Smoke over Athens

The effects of forest fires show up in a multi-satellite view of pollution.

On the tail of three scorching heat waves in the summer of 2007, massive forest fires broke out across Greece and destroyed thousands of acres of forest, olive groves, and farmland. Heavy plumes of smoke billowed from burning forest canopies, and ash from the fires dusted ancient and modern buildings in nearby cities and towns. Numbering 3,000 from June to early September, the fires were the worst that Greece had seen in fifty years.

Athens is already one of the most polluted cities in Europe, more so in the summer when humidity and the intense Mediterranean sun heat up industrial and vehicular pollutants lingering in the atmosphere. Did the forest fires cause the city’s air pollution levels to get worse? Researchers in Greece could not answer this question easily. Most of the fires burned in rural areas where there were no ground-based instruments to measure pollution. The fires also produced gigantic smoke plumes that blew hundreds of miles from inland, across coastlines, and on to the Ionian Sea. These plumes were difficult to study using available ground monitoring networks alone.

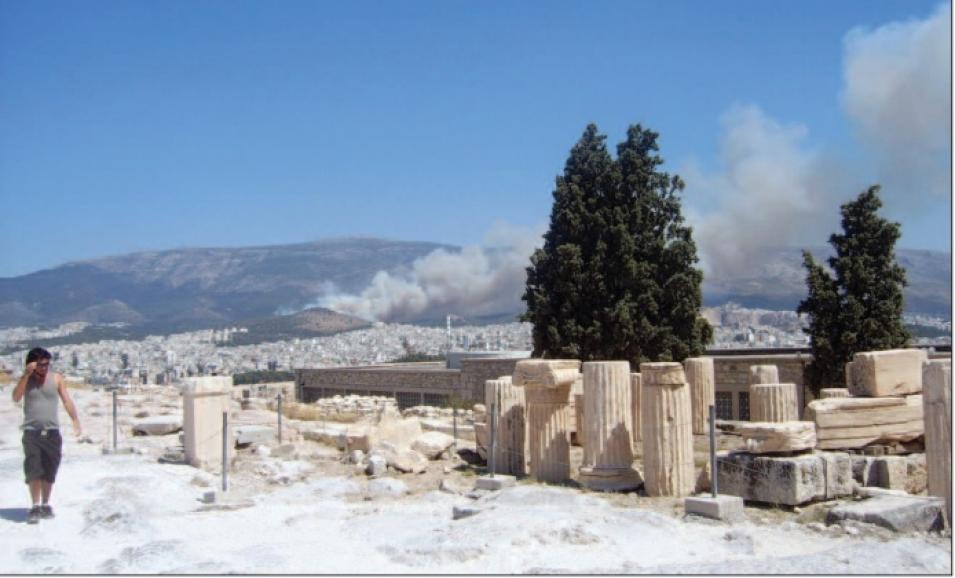
Acropolis smoke plumes
Image Caption

A man walks through the Acropolis while smoke plumes billow from a forest fire near Athens on July 25, 2007. More than 3,000 forest fires burned in Greece that summer, mostly in areas where there were no ground instruments to observe the impact of the smoke on air quality. (Courtesy V. Berger)

The Greek government turned to the Harvard School of Public Health for help. Yang Liu studies air quality using remote sensing data and was a research associate there at the time of the Greek fires. He said, “The best tool was satellite remote sensing. We happened to have cloud-free days during most of the fire episodes, and that was ideal for satellites to observe the transport and the evolution of those plumes.” Liu, now an assistant professor at Emory University’s Rollins School of Public Health, knew that satellite sensors were a fairly new information source for air pollution studies. But he suspected that the right combination of satellite sensors could reveal how the forest fires affected Athens’ already fragile air quality.

Two pollution spikes

Pollution peaked twice in the Athens area during the last week of August and the first week of September. From August 24 to 28 and then again from August 30 to September 3, the average concentration of air particles in Athens reached a density of nearly 100 micrograms per cubic meter. These measurements were far above the European Union Ambient Air Quality Standard of fifty micrograms per cubic meter. “We wanted to know if some or all of these pollution peaks were caused by the fire plumes,” Liu said.

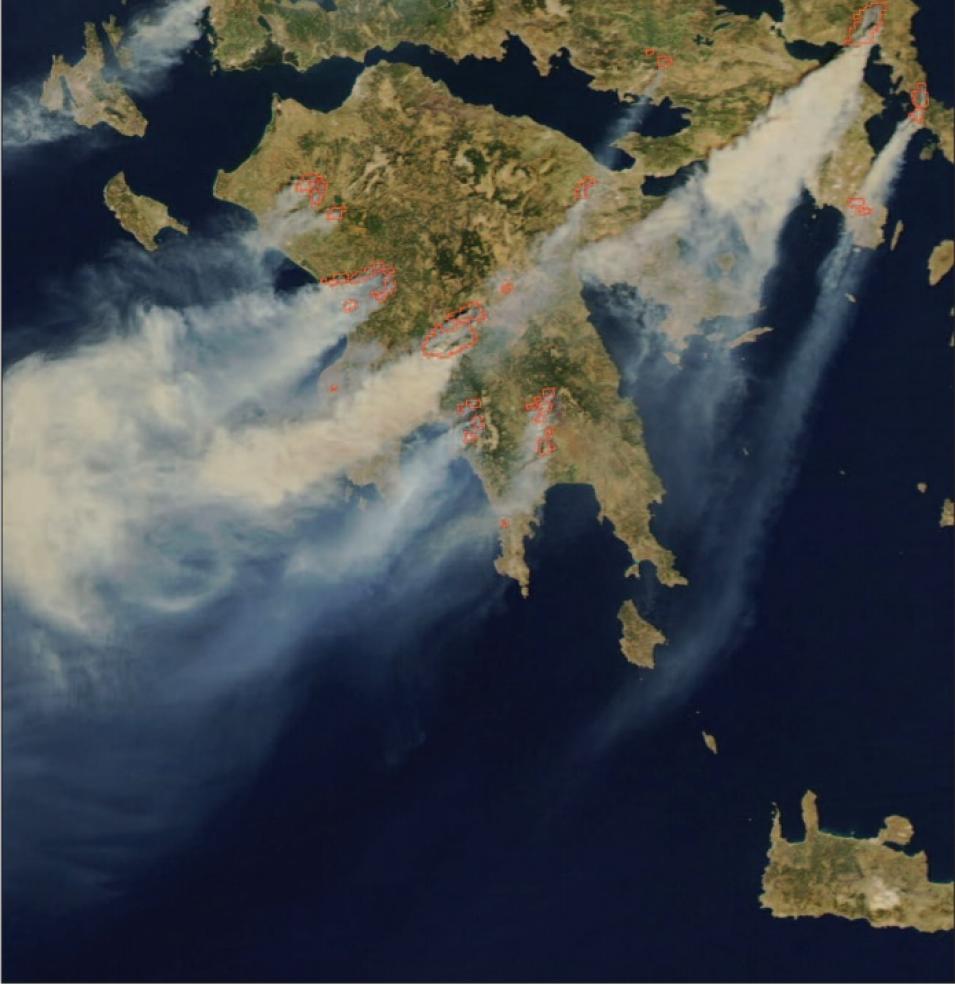
To find out if the pollution episodes could be traced to the fires, Liu first needed to know if smoke plumes from the fires had drifted to Athens. Liu checked for smoke plumes using true-color satellite images of Athens and the vicinity from the Moderate Resolution Imaging Spectroradiometer (MODIS) instrument on NASA's Terra and Aqua satellites.

MODIS Greece forest fires
Image Caption

Smoke from forest fires in Greece on August 25, 2007, is evident in this satellite image from the Moderate Resolution Imaging Spectroradiometer (MODIS) instrument. The active forest fires, outlined in red, occurred in the Peloponnese and Attica regions, and on the island of Evia. Long-range smoke plumes from Evia extend west over the city of Athens toward the Ionian Sea. (Courtesy MODIS Rapid Response Project, NASA Goddard Space Flight Center)

He determined plume height and direction by using numerical weather models, and then validated the information with data from the Multi-Angle Imaging Spectroradiometer (MISR) sensor on NASA's Terra satellite, available from NASA's Atmospheric Science Data Center (ASDC). Ralph Kahn, a senior research scientist at NASA's Goddard Space Flight Center, worked with Liu on the study. He said, “Plume height is important. How high the smoke is injected into the atmosphere by the fire determines how far the smoke particles travel from these fires, in which direction they travel, and how long they stay in the atmosphere. Numerical weather models complement the snapshots from MISR and MODIS, filling in what the polar-orbiting satellite instruments miss.”

During the first pollution episode, MODIS true-color images showed smoke plumes southwest of Athens in the Peloponnese region, and northwest in the country of Albania. MODIS also detected fire spots on the island of Evia, northeast of Athens, and in nearby forested areas northwest of the city. MISR detected plume heights from the Peloponnese fires that were 2.5 kilometers (1.6 miles) high. But weather and wind data showed that a southwesterly wind blew the smoke plume away from Athens and into the Ionian Sea. The same wind blew the smoke plumes from the Evia Island fires right into the city. Liu said, “As a result, the Evia fire is probably a major contributor to increased pollution in Athens during this period.” In the second episode, MODIS only detected minor fire spots in the Peloponnese region, and several fire spots in Albania. MISR detected no major smoke plumes.

With two very different pollution episodes, the first with smoke plumes blowing into Athens from Evia, and the second without any dominant smoke plume blowing into the city, Liu and Kahn then needed to figure out what quantities of aerosols—tiny particles of solid or liquid suspended in the air—were present in the atmosphere. They also needed to find out what kinds of aerosols were hovering over the city.

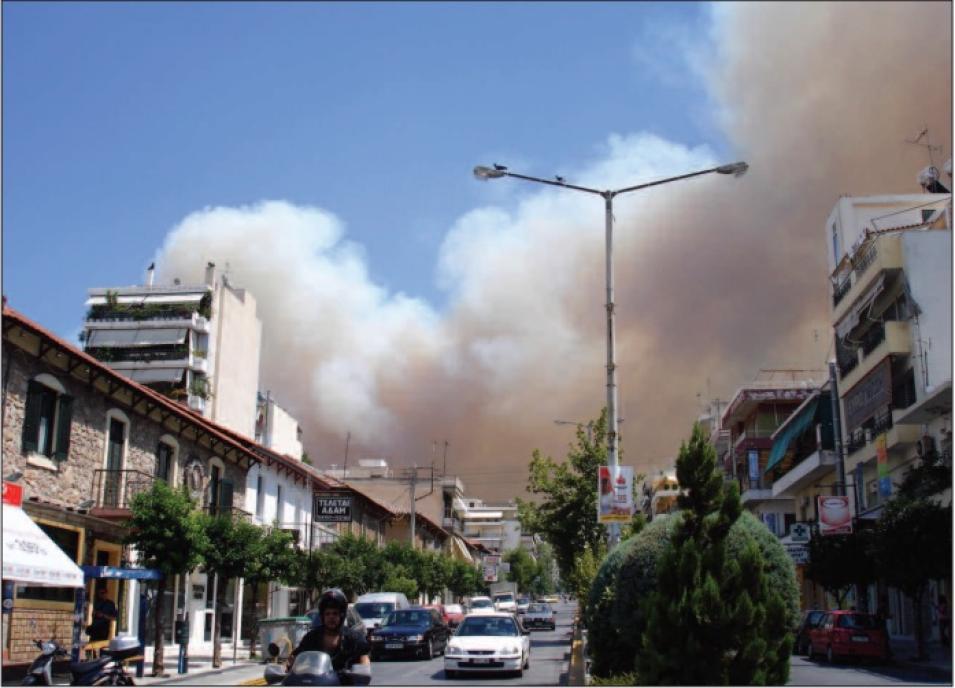
Mount Hymettus fire
Image Caption

Smoke obscures the midday Athens sky in this August 25, 2007, photo. A portion of the forest on Mount Hymettus was burning. (Courtesy A. Babili)

Slicing through smoke

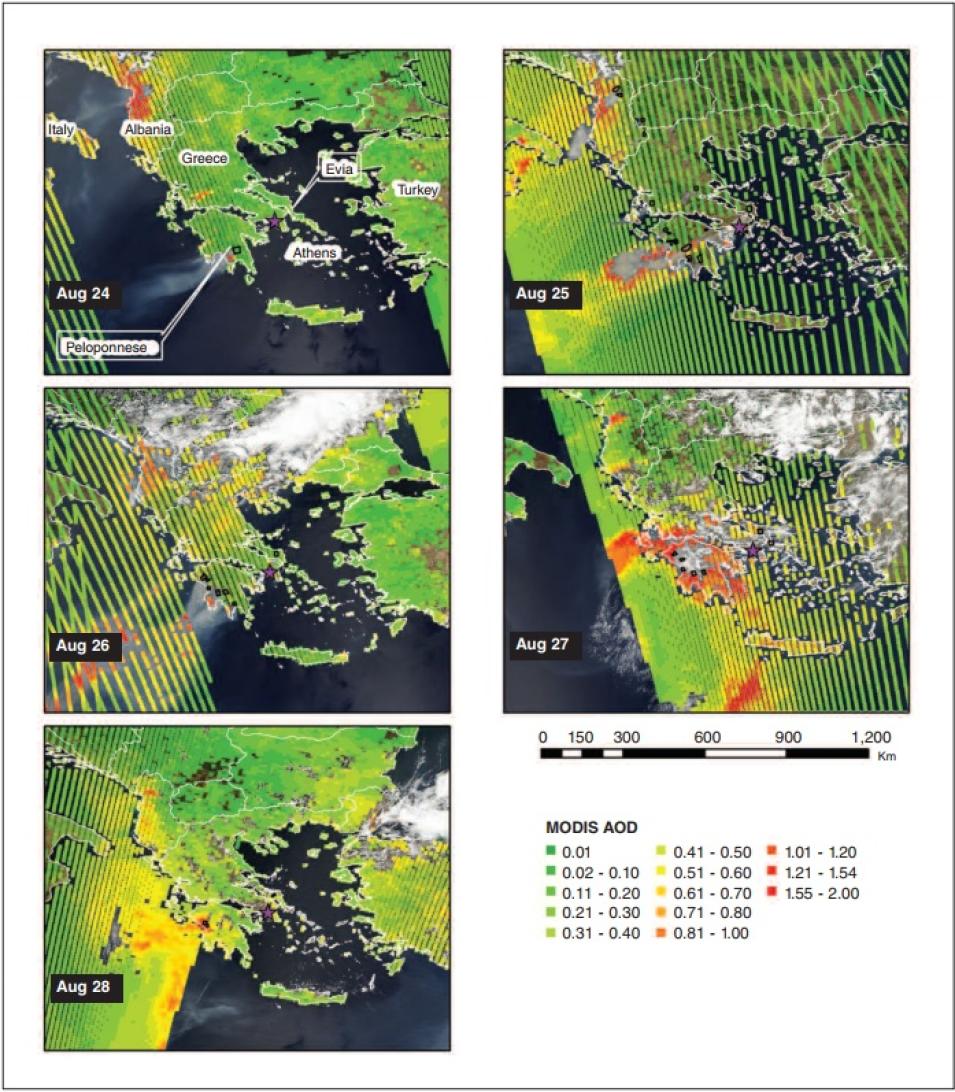
To observe aerosol abundance, Liu and Kahn needed an instrument that could observe huge areas, such as the length and breadth of the Peloponnese smoke plume. They used total column aerosol optical depth (AOD) data from MODIS, distributed by NASA's Level 1 Atmosphere Archive and Distribution System Distributed Active Archive Center (LAADS DAAC). Kahn said, “MODIS was the ideal instrument because it has a swath of 2,300 kilometers [1,400 miles] and observes the entire Earth at least once in two days.” Liu superimposed these data over MODIS true-color images of the fire sites during the two episodes, and used this combination to determine pollution intensity and source location. The MODIS AOD data confirmed what the weather and plume height observations suggested for the first pollution peak: that smoke from Evia had blown into Athens, and residual, circling smoke from the Peloponnese region drifted into Athens from the south toward the end of the period. MODIS AOD data for the second episode showed that aerosol abundance was higher in Athens than in surrounding areas.

At this point, it seemed clear that smoke from the forest fires might not have affected Athens during the second pollution episode. But were the fires responsible for the first one? To answer this question, Liu and Kahn needed to know what kinds of aerosols were present in Athens during the two periods. They used data from the Ozone Monitoring Instrument (OMI) on NASA’s Aura satellite, archived at NASA's Goddard Earth Sciences Data and Information Services Center (GES DISC), and aerosol type data from ground instruments. Kahn said, “OMI can distinguish particles by the way they reflect light back into the sensor. This tells something about what the particles are made of, and gives us clues to where they come from. We also added ground-based measurements to the mix because they are much more precise.” Liu and Kahn’s colleagues—Archontoula Chaloulakou, at the National Technical University of Athens, and Petros Koutrakis, at the Harvard School of Public Health—provided the ground instrument data.

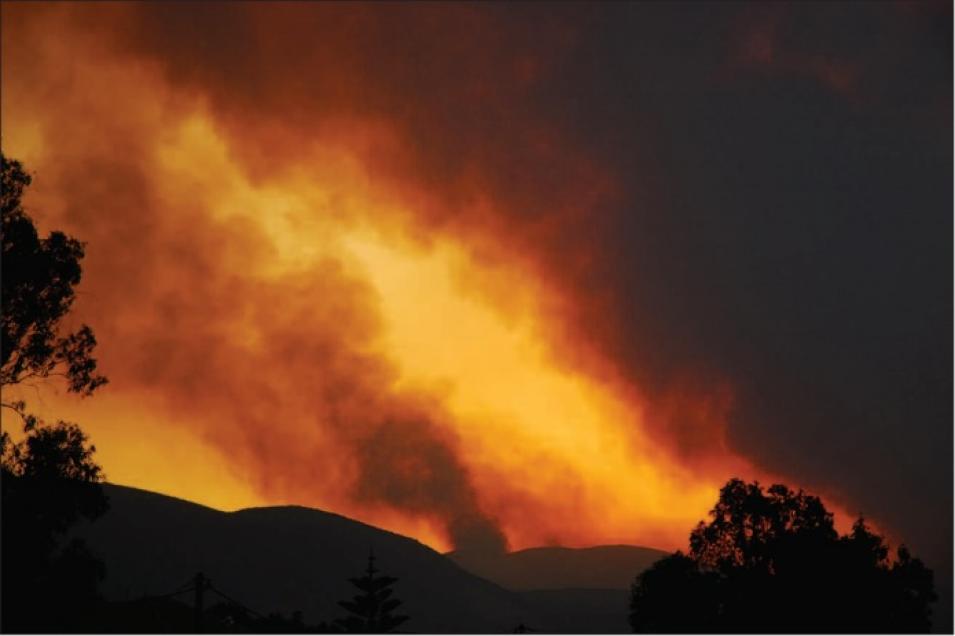
Zakynthos fire
Image Caption

A forest fire burns on the island of Zakynthos in Greece on the evening of July 25, 2007. Heat waves, a strong wind, and arson caused many fires in Greece that summer, adding smoke plumes to an already polluted skyline. (Courtesy C. Osbourn)

What Liu and Kahn found out surprised them. The combination of aerosol type data showed that during the first episode, the average pollution contribution from forest fires was 28 micrograms per cubic meter, but pollution from traffic emissions and other sources was 33 micrograms per cubic meter. During the second episode, forest fires contributed an average of 17 micrograms per cubic meter, but traffic emissions contributed 48 micrograms per cubic meter. Liu said, “Fire plumes contributed aerosols more significantly to the pollution spike in the first episode, and to a lesser extent in the second episode. But during both episodes, emissions from vehicles in Athens still dominated the aerosol composition.”

Smog versus smoke

To Liu and Kahn, the results were consistent with what researchers have observed in other countries. Liu said, “Even during the height of the forest fires, local traffic remained the number one contributor to air pollution levels. In Athens, as in many cities all over the word, the major contributor to air pollution is still vehicular traffic.”

The use of multiple remote sensing instruments helped paint a more detailed picture of the forest fires’ impact on the air quality in Athens. “Multiple instruments tell a better and more complete story than any individual instrument can, and they also cross-validate each other,” Liu said. Kahn agree, saying, “We have the tools. In situ air quality measurements are made routinely from the surface. But combining them with satellite data gives you a much broader perspective.”

MODIS AOD Greece
Image Caption

These images, from the Moderate Resolution Imaging Spectroradiometer (MODIS) on NASA’s Aqua and Terra satellites, show total column aerosol optical depth (AOD) overlaid on MODIS true color images. The images reveal a concentration of aerosols from the island of Evia drifting to Athens on August 25, and another concentration of aerosols drifting into the city from the Peloponnese region on August 27. Black polygons represent fire spots, and the purple star represents the city of Athens. Orange and red indicate higher aerosol levels, while blue and green indicate lower levels. (Courtesy Y. Liu)

Liu and Kahn even discovered new possibilities for one sensor. Liu said, “It’s interesting to note that MODIS behaved very well during the two episodes. It tracks ground level pollution very well.” MODIS works best when the pollution is sulfate-dominated, the kind that comes from industrial sites. But during the two pollution peaks, pollution was dominated by motor vehicle emissions. “In our two episodes, pollution was composed of nitrate, black carbon, and organic carbon. But the MODIS instrument still worked very well,” Liu said.

Remote sensing is proving to be an important tool in monitoring air quality in major urban areas worldwide. Liu said, “We are entering the age of air quality monitoring from space. Carefully interpreted satellite data can give us valuable information about air pollution conditions and forest fire episodes. Although still at its infancy, satellite-based air quality monitoring has started to provide early warnings of pollution events to major urban areas all over the world.”

References

Liu, Y., R. Kahn, A. Chaloulakou, and P. Koutrakis. 2009. Analysis of the impact of the forest fires in August 2007 on air quality of Athens using multi-sensor aerosol remote sensing data, meteorology, and surface observations. Atmospheric Environment, doi:10.1016/j.atmosenv.2009.04.010.

Yang Liu, interview by Lindsay Patterson, Earth sky: A clear voice for science. November 25, 2008. https://earthsky.org/human-world/yang-liu-at-the-intersections-of-air-pollution-and-public-health

For more information

NASA Atmospheric Science Data Center (ASDC)

Moderate Resolution Imaging Spectroradiometer (MODIS)

MODIS Rapid Response System

Multi-angle Imaging SpectroRadiometer (MISR)

Ozone Mapping Instrument (OMI)

About the remote sensing data
Satellites Terra and Aqua Terra Aqua
Sensors Moderate Resolution Imaging Spectroradiometer (MODIS) Multi-angle Imaging SpectroRadiometer (MISR) Ozone Mapping Instrument (OMI)
Data sets MODIS Level 2 Aerosol MISR Level 2 Products Near-UV Aerosol Optical Depth and Single Scattering Albedo
Resolution 10 kilometer, derived from Level 1 radiance data at 0.5 and 1.0 kilometer 1.1 kilometer 13 x 24 kilometer nominal resolution at nadir
Parameters Aerosol optical depth Stereo height Aerosol index and associated aerosol types
DAACs NASA Level-1 and Atmosphere Archive and Distribution System Distributed Active Archive Center (LAADS DAAC) NASA Atmospheric Science Data Center (ASDC) NASA Goddard Earth Sciences Data and Information Services Center (GES DISC)

Details

Last Updated

Published

Data Center/Project

Atmospheric Science Data Center (ASDC)
Goddard Earth Sciences Data and Information Services Center (GES DISC)
Level 1 and Atmosphere Archive and Distribution System DAAC (LAADS DAAC)