Seeing the Forest for the Carbon

Researchers peer deep into tropical forests, weighing their status as climate balancers.

Just as X-rays, Magnetic Resonance Imaging (MRI), and other imaging tools allow a doctor to examine the bones, muscles, and organs inside the human body, an ecologist can use satellites to peer deep into forests. Like doctors, ecologists can combine data from several tools to get multiple layers of information about the structure of forests, and learn more about the content of the forests and the health of the planet.

Josef Kellndorfer is a satellite data specialist at Woods Hole Research Center (WHRC) who is helping those ecologists by leading a project to map carbon all over the world’s tropical forests. He said, “How much carbon is stored in forests, and exactly how much is getting released, is a big unknown. We can track a parcel of land being deforested, and we can estimate how much carbon is being released from that small area. But we need to be able to do that on a global or tropical scale.” If tropical countries had this information, they might be able to reduce deforestation and carbon emissions, with support from international programs.

deforestation
Image Caption

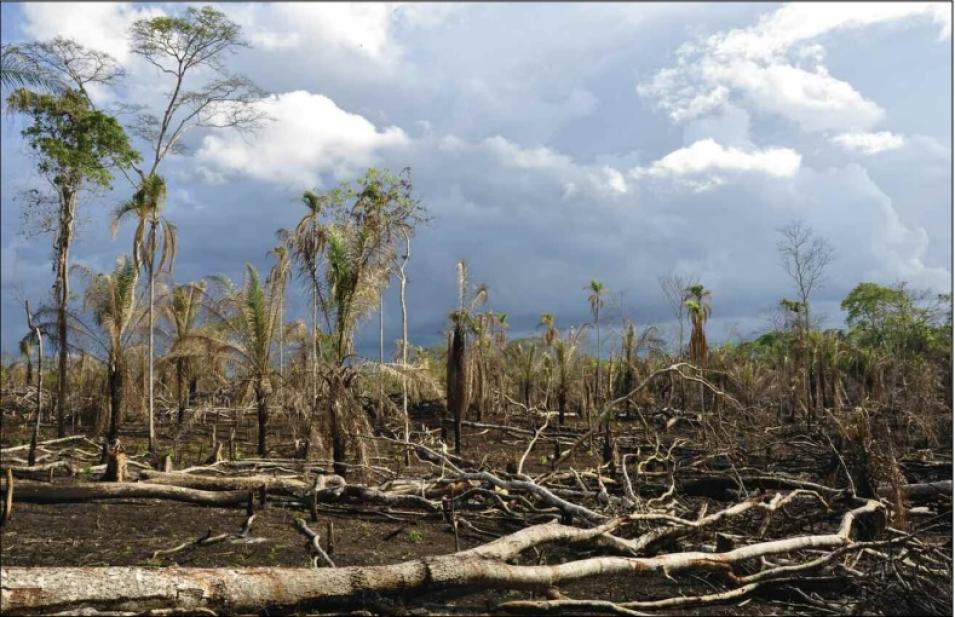
Wide-scale deforestation is a major concern in tropical countries. This forest in Bolivia once hosted diverse animals and plants, and protected rivers and streams from erosion. The release of carbon stored in the forests can tip Earth’s carbon balance. (Courtesy W. Walker)

A multilayered carbon map

When a tree falls in the forest, carbon escapes into the air. While auto exhaust and industrial emissions make up the majority of carbon emissions, 15 to 20 percent of the carbon compounds humans release instead come from deforestation. Tim Pearson, who advises on climate change mitigation at Winrock International, said, “When wood is converted to lumber products, there’s only about a 50 percent efficiency. Half of the tree goes up into the atmosphere. Even if you just let it decompose, the carbon in wood ends up in the atmosphere.” In addition, burning forests to open land for farming—a widespread practice in the world’s tropical rain forests—releases the carbon in tree roots, trunks, and branches, as carbon dioxide and carbon monoxide.

The most accurate way to measure the biomass, or carbon content, of a forest would be to chop down all the trees, dry them out, and weigh them: clearly not a realistic method. The next best option is to hike out into forests and measure the height and girth of a sample of trees. Scientists then use statistical formulas to estimate the amount of carbon in a region.

woods hole research center
Image Caption

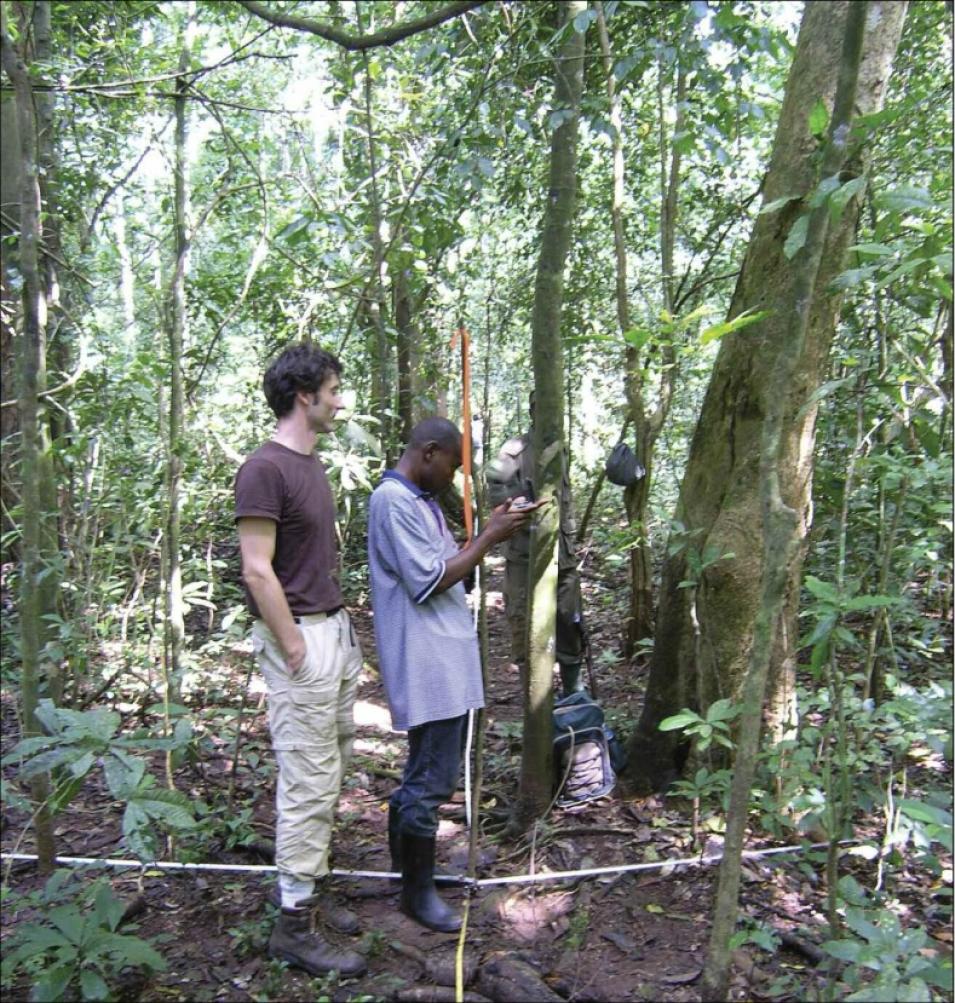
A Woods Hole Research Center (WHRC) scientist, left, shows a Ugandan forest ranger how to measure trees to help calculate how much carbon a forest contains. Measurements from local people are vital in assembling a global satellite view of forest carbon stocks. (Courtesy WHRC)

These field methods work well on a small scale, but to get a consistent global picture, researchers need a global tool. Satellite data provide this bigger picture. However, the task is not so straightforward. Kellndorfer said, “What we’re really trying to get at are measurements related to carbon. And no single sensor gives us the entire spectrum alone.” So Kellndorfer and his colleagues at WHRC are using three different satellites.

To learn where forests exist versus non-forested land, Kellndorfer and WHRC researcher Alessandro Baccini used visual data from the Moderate Resolution Imaging Spectroradiometer (MODIS) sensor on NASA's Aqua and Terra satellites. The MODIS data offer a continuous map of tree cover that spans a wide swath of tropical countries around the globe. WHRC researcher Scott Goetz said, “MODIS measures reflected radiation in the optical, visible and near-infrared, and mid-infrared ranges. It also provides an estimate of the canopy density.”

To get a more detailed picture of the trees in the forest, they used lidar data from the Geoscience Laser Altimeter System (GLAS) instrument aboard the Ice, Cloud, and Land Elevation (ICESat) satellite. The lidar data provide a vertical profile of the forest structure, from trunk to treetop, allowing the researchers to determine the forest height and the complexity of its branch structure. Unlike MODIS, which supplies a continuous picture of tropical forest cover, the lidar data take only snapshots: circles 70 meters (230 feet) in diameter, separated by miles. However, the small snapshots give a unique picture of the forest structure. Goetz said, “The lidar penetrates the whole canopy all the way to the ground, and it is by far the best remote sensing tool we have to relate to biomass.”

pantropical forest cover
Image Caption

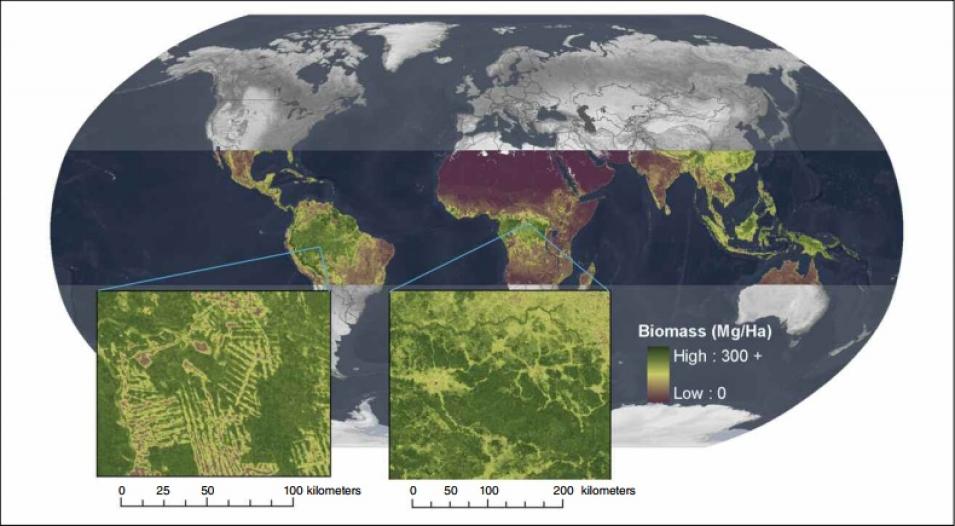
This pantropical map of forest cover combines two types of remote sensing data to estimate the amount of carbon, or biomass, contained in the world’s tropical forests. Green indicates regions with greater forest cover, and higher biomass, while purple represents regions with little or no biomass. Data are from the Moderate Resolution Imaging Spectroradiometer (MODIS) sensor on the NASA Terra and Aqua satellites, and from the Geoscience Laser Altimeter System (GLAS) instrument on NASA’s Ice, Cloud, and Land Elevation (ICESat) satellite. (Courtesy Baccini et al. 2009)

Finally, the scientists needed a tool to measure the density of the forest canopy, the leafy top part of the forest, which is closely related to carbon content. For that, they used the Phased Array Type L-band Synthetic Aperture Radar (PALSAR) sensor on the Japanese Advanced Land Observation Satellite (ALOS) satellite. The PALSAR data provide more information about the forest canopy. The radar also penetrates the thick clouds that often cloak tropical rain forests, and bounces off the small branches and leaves high up in the treetops. Kellndorfer said, “The cloud cover over tropical forests can hide the forests from satellite sensors. The radar lets us see through those clouds.”

Field and algorithm

But even with data from multiple sensors, the satellite data alone cannot fully account for forest carbon. Goetz said, “Field measurements are essential. We need them to calibrate and verify the remote sensing measurements.” Pearson agreed, saying, “The problem with remote methods is that they look at the spectral signatures or radar returns that come from a forest. The relationship between a spectral signature or a radar return and carbon content is not as simple as the relationship between the girth and height of the tree and its carbon content.” To get at this relationship, the scientists need to tie their measurements to actual trees.

So the WHRC researchers travel to countries around the tropics and hike deep into the jungle to find the exact spots of lidar data. Wayne Walker, a WHRC researcher who has worked extensively on the field portion of the project, said, “During one field campaign in Vietnam, we had to rent scooters and motorcycles to get where we needed to go. A group of us traveled two hours to a field station, and then we had to hike for several hours to actually get to the location of the GLAS shot we wanted to sample.”

MODIS GLAS biomass density
Image Caption

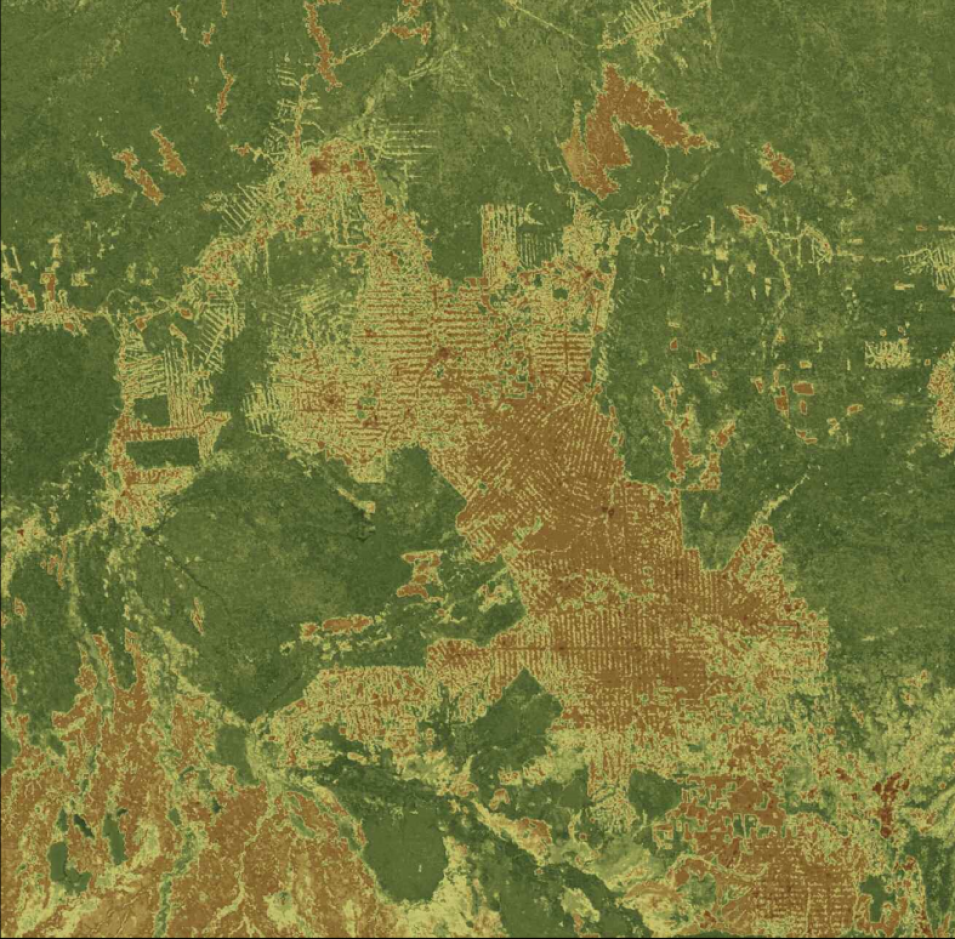
This map shows spatial patterns of biomass density in the western Amazon Basin. Green represents areas of high biomass, while brown areas are bare ground. The herringbone road pattern in some of the brown areas represents areas of recent deforestation. Researchers hope that a map of carbon stocks for the whole tropical region will serve as a scientific basis for efforts to reduce deforestation and carbon emissions. Data are from the NASA Moderate Resolution Imaging Spectroradiometer (MODIS) sensor and the Geoscience Laser Altimeter System (GLAS) instrument. (Courtesy Baccini, et al. 2009)

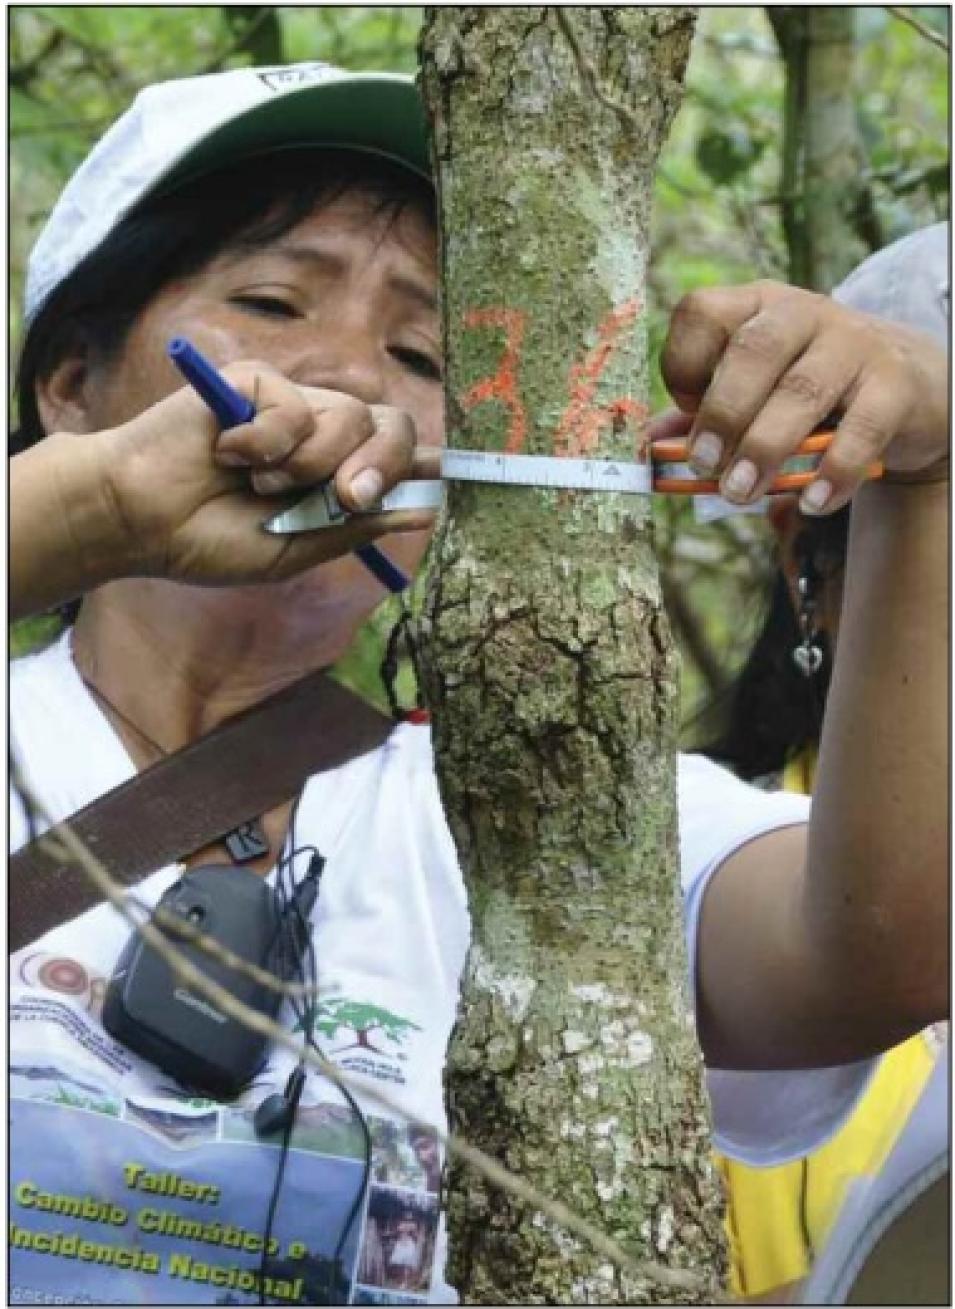
The WHRC team, which also includes researcher Nadine Laporte, is also training local forest rangers, indigenous groups, and governments to conduct field measurements of the forests where they live, and to compare those measurements with satellite data. Walker said, “We are trying to provide people in tropical countries with the tools and techniques that they will need to generate their own data sets.”

Kellndorfer said, “It’s critical that we not impose our measurements of the biomass of a country, and that the people in the countries are involved. So we’re setting up workshops in tropical countries, training people on how biometric surveys in forests are done, and how to relate them with the satellite measurements.” In this way, each country gains an understanding of methods for quantifying carbon stocks, and an ownership of the process.

Preserving forests can also help these same local people, who get their livelihoods and food from the forests they live in, and can help maintain ecosystems by protecting soil from erosion and maintaining healthy rivers and streams. An abundance of animals and plants live in the tropical forests that are threatened by deforestation. Goetz said, “Countries all want to know how much carbon they have standing in their forests, because it’s worth money to protect it. But these forests are valuable not just in terms of carbon; they are also valuable in terms of biodiversity.”

stem diameter measurement
Image Caption

A workshop participant practices stem diameter measurements, near Concepción, Bolivia. (Courtesy W. Walker)

Global maps, local benefits

The WHRC team has now created two forest maps that span the tropics: one based on PALSAR radar data, and the other using MODIS and GLAS data to estimate biomass across the tropical region. The next step is to combine the two maps and validate the data with field measurements taken by the WHRC team and local people. Kellndorfer and his colleagues believe that the data will allow them to build an unprecedented map of tropical forest carbon. “We have data sets that cover the entire tropical belt, from 23 degrees north to 23 degrees south,” Kellndorfer said. “Now we are trying to convert initial data sets to forest cover and carbon estimates.”

When the carbon map is complete, the team plans to give it free of charge to people around the world. Countries will be able to use it for a reference, and add their own field data to improve regional carbon estimates. Walker said, “It’s fitting that we’ll be able to release this to the public for free, because the product doesn’t just belong to us. It belongs to all those folks around the world who have contributed to it.”

References

Baccini, A., N.T. Laporte, S.J. Goetz, M. Sun, and H. Dong. 2008. A first map of tropical Africa's above-ground biomass derived from satellite imagery. Environmental Research Letters, doi:10.1088/1748-9326/3/4/045011.

Baccini, A., N.T. Laporte, S. Goetz, M. Sun, W. Walker, J. Kellndorfer, and R.A. Houghton. 2009. Pantropical forest carbon mapped with satellite and field observations. Report for the United Nations Framework Convention on Climate Change 15th Conference of the Parties, 7-18 December 2009, Copenhagen, Denmark. http://www.whrc.org/policy/pdf/cop15/biomass_cop15.pdf.

For more information

NASA Alaska Satellite Facility Distributed Active Archive Center (ASF DAAC)

NASA Land Processes DAAC (LP DAAC)

NASA National Snow and Ice Data Center DAAC (NSIDC DAAC)

Moderate Resolution Imaging Spectroradiometer (MODIS)

Geoscience Laser Altimeter System (GLAS)

The United Nations Collaborative Programme on Reducing Emissions from Deforestation and Forest Degradation in Developing Countries

Woods Hole Research Center Pan-Tropical Mapping of Forest Cover and Above-Ground Carbon Stock

About the remote sensing data
Satellites Advanced Land Observation Satellite (ALOS) Terra and Aqua Ice, Cloud, and Land Elevation Satellite (ICESat)
Sensors Phased Array Type L-band Synthetic Aperture Radar (PALSAR) Moderate Resolution Imaging Spectroradiometer (MODIS) Geoscience Laser Altimeter System (GLAS)
Data sets 23 centimeter L-band radar 500 meter Nadir BRDF-Adjusted Reflectance (NBAR) GLAS/ICESat L2 Global Land Surface Altimetry Data
Resolution 10 to 20 meter 500 meter 70 meter circles
Parameters Vegetation cover Vegetation Elevation
DAACs NASA Alaska Satellite Facility Distributed Active Archive Center (ASF DAAC) NASA Land Processes DAAC (LP DAAC) NASA National Snow and Ice Data Center DAAC (NSIDC DAAC)

Details

Last Updated

Published

Data Center/Project

Alaska Satellite Facility DAAC (ASF DAAC)
Land Processes DAAC (LP DAAC)
National Snow and Ice Data Center DAAC (NSIDC DAAC)