Probing the Arctic Atmosphere

One of the least industrial areas of Earth is a crossroads for pollution.

In a bustling room in Fairbanks, Alaska, a group of researchers watched two blips move eastward on a map of the Arctic. After an eight-hour flight collecting atmospheric data over northern Canada, the blips—two airplanes riddled with sensors—had almost reached Thule, Greenland. Jennifer Olson, an atmospheric chemist, worked on data archiving and flight planning during NASA's 2008 Arctic Research of the Composition of the Troposphere from Aircraft and Satellites (ARCTAS) experiment. Olson said, “We were about to leave for the day, when we saw that one of the airplanes had not stopped in Thule. It was continuing on.”

Strong winds in Thule, Greenland, forced the pilots of NASA's McDonnell Douglas DC-8 to look for a calmer spot to land. The scientists had to rethink their carefully planned research flight. Flight time was limited during the mission, and the researchers in Fairbanks found themselves scrambling through satellite data, weather maps, and pollution forecasts to rebuild a flight plan that would allow the scientists on the airplane to take a few more measurements. Getting the most out of each research flight was key to the success of the field experiment. Olson said, “We just wanted to squeeze any science that we could out of the situation.”

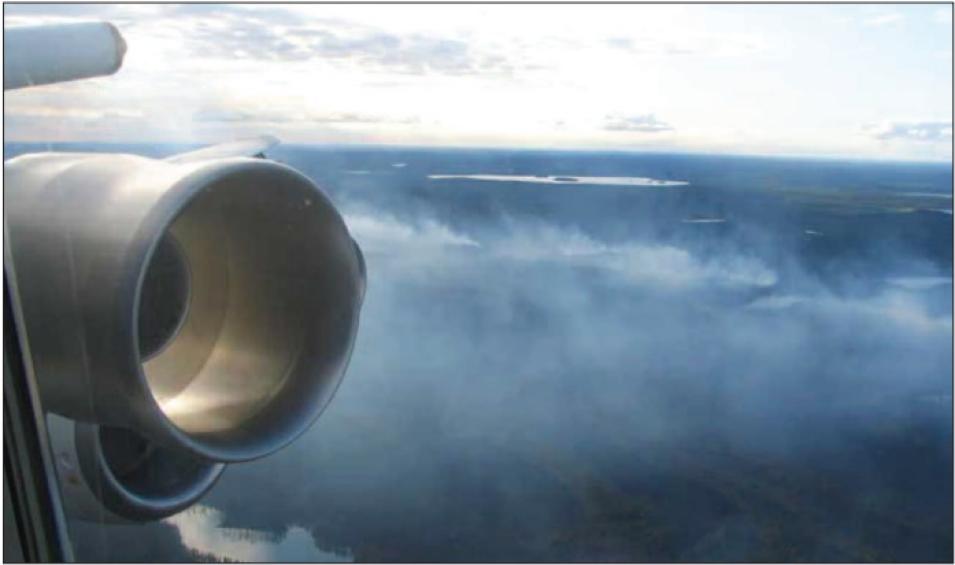
DC8 smoke plume
Image Caption

A view from an airplane window reveals some of the pollution that smothers the Arctic each spring and summer. Instruments aboard the airplane collected data from the smoke plume, generated by a forest fire over Canada on July 1, 2008. (Courtesy NASA)

ARCTAS, a NASA field campaign that took place during two separate missions in 2008, explored many details of the Arctic atmosphere. Researchers want to learn more about air quality and aerosols in the Arctic, because increasing pollution in the region will likely impact delicate ecosystems and climate.

Airplanes, satellites, and scientists

In the control room in Fairbanks, the researchers used a new tool called the NASA Real-Time Mission Monitor (RTMM) to look for places that the diverted DC-8 could collect data as it swung back from Greenland to land in Iqaluit, Canada. Scientists at NASA's Global Hydrometeorology Resource Center (GHRC) developed RTMM to provide real-time information and communication tools during field missions. While most of the forty-four spring flights during ARCTAS went smoothly, RTMM proved especially helpful for the flight diverted from Thule.

Using RTMM, the scientists in Fairbanks looked through pollution models, satellite data, and weather, overlaid on a Google Earth map. They quickly located a nearby area that showed high levels of bromine oxide, a chemical that contributes to ozone depletion. The team on the ground discussed the options with the team in the air, using a special text-messaging server located in Colorado, and the aircraft’s Internet gateway at NASA Dryden Flight Research Center in California. Armed with information and the ability to communicate between ground and air, the team was able to quickly work out a plan to take further measurements.

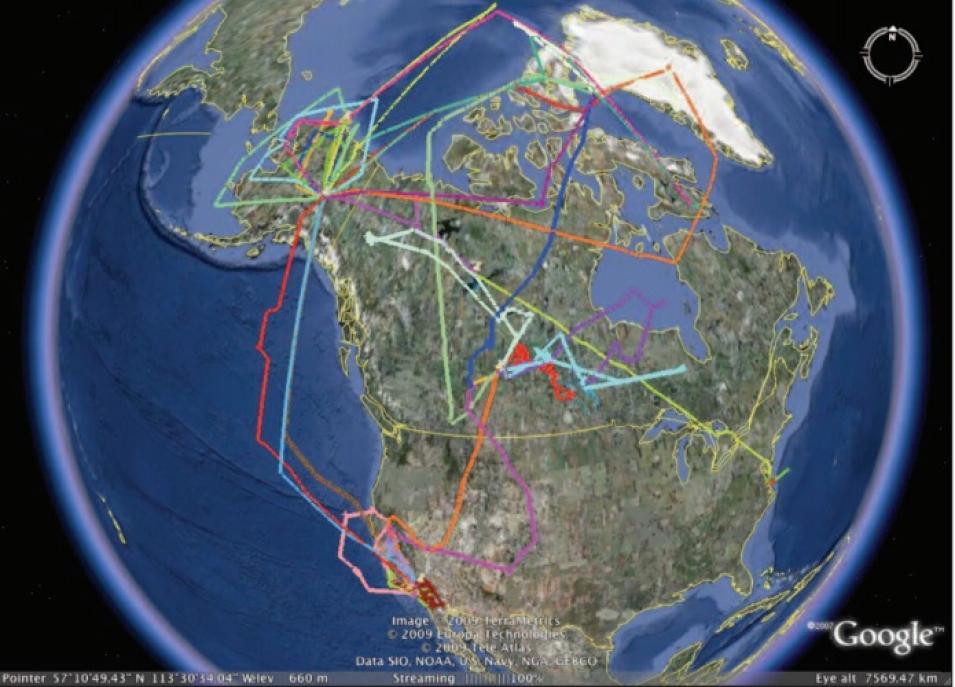
ARCTAS flights
Image Caption

During the Arctic Research of the Composition of the Troposphere from Aircraft and Satellites (ARCTAS) field campaign, scientists flew eighty-six research flights to gather data on the Arctic atmosphere. This Google Earth image shows the flight tracks for the three NASA airplanes that collected data on pollutants and atmospheric properties during spring and summer of 2008. (Image courtesy L. Emmons, NASA)

“Having that capability was great,” Olson said, “We had the satellite data and the airplane information, and we were able to communicate directly with people on the airplane. In the past, they most likely would have just gone straight to the other airport, but we were able to get a little more work done.”

Data from the Arctic sky

In recent decades, the Arctic has warmed more than any other region on Earth. However, scientists know less about the Arctic atmosphere than they do about most other places on the planet. The spring portion of ARCTAS focused on Arctic haze, the heavy air pollution that obscures the sky in spring. Louisa Emmons, an atmospheric chemist at the National Center for Atmospheric Research (NCAR) worked in Fairbanks during the field experiment. She said, “Arctic haze has been observed from the ground for a long time, but we don’t completely understand it.” During the spring portion of ARCTAS, researchers explored the effect of Arctic haze on climate, studied where the haze came from, and compared airplane measurements to ground and satellite measurements.

Scientists think that Arctic haze probably has an effect on temperatures, an effect called radiative forcing. Emmons said, “Adding more aerosols to the air can heat or cool the atmosphere.” But it is not clear whether the dominant effect is warming or cooling. Like the insulation in a house, the aerosols that make up air pollution can trap heat close to the Earth. They can also work the opposite way to keep temperatures cool, by reducing the amount of heat that gets to the ground in the first place.

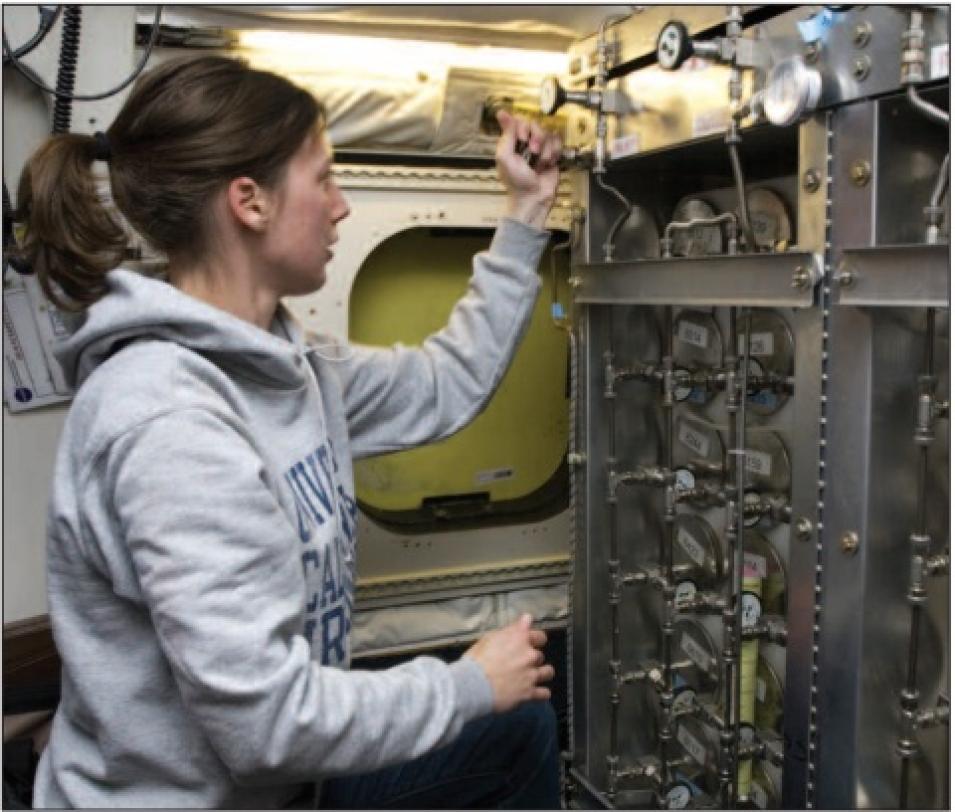
DC8 air sampler
Image Caption

University of California, Irvine, graduate student Katrine Gorham operates an air sampler on a NASA DC-8 airplane during an Arctic Research of the Composition of the Troposphere from Aircraft and Satellites (ARCTAS) flight. (Courtesy NASA/Eric James)

ARCTAS researchers also wanted to find out exactly where Arctic haze originates. “For many years, we assumed that Arctic haze came mostly from power plants in Europe,” Emmons said. However, recent studies have shown that pollution from North America and Asia, and forest fires in northern Asia, also contribute to the haze. During ARCTAS, airplanes outfitted with a variety of sensors flew through pollution plumes and measured chemicals that can show what type of combustion initiated the plume. These sensors gathered data that could not be measured with current satellite-based pollution sensors. Emmons said, “Several current satellite instruments measure carbon monoxide, and that gives us a nice picture of pollution plumes around the globe. But there are many sources of carbon monoxide: fires, traffic, and power plants. If we look at the relative contributions of other gas-phase species and aerosols, we can sort out whether a plume came from fires in Canada or anthropogenic pollution in China.”

Finally, ARCTAS researchers took advantage of the multiple research flights to collect data for comparison with existing satellite measurements. “It’s a challenge to get good information over snow- and ice-covered regions,” Emmons said. Just as the reflection off the shiny surface of a glacier makes it hard to see, the reflective ice and snow in the Arctic can make it challenging for satellites to collect accurate data. Collecting data from an airplane at the same place and time that a satellite passes over allows scientists to compare the data. Emmons said, “This is an opportunity to see what the limits of satellite retrievals are in the Arctic, and to get more information out of them.”

ARCTAS researchers are now working to integrate the information collected from the mission into pollution and climate models. Emmons said, “If our models work well for this experiment, we can then do future scenarios, and better understand how climate might change under different conditions.”

Arctic climate and pollution

The Arctic serves as a waste bin for air pollution, which builds and persists through the Arctic spring and summer. But scientists know little about how that pollution may affect regional climate and ecosystems. Scientists hope that research stemming from the ARCTAS field mission will bring some much-needed clarity to the hazy information on the Arctic atmosphere.

The ARCTAS experiment was the largest field mission ever to explore the Arctic atmosphere. Emmons, Olson, and the other researchers who worked on the experiment still have a challenge ahead of them: making sense of the thousands of data points collected during the experiment. Emmons said, “We’re putting everything together now. It’s a pretty complex system, but if we improve our models for regional pollution transport, we could better understand the climate implications of pollution in the Arctic.”

References

Blakelee, R., J. Hall, M. Goodman, P. Parker, L. Freudinger, and M. He. 2007. The Real Time Mission Monitor—A situational awareness tool for managing experiment assets. NASA Science and Technology Conference 2007, 19−21 June 2007, College Park, MD.

NASA aircraft examine impact of forest fires on Arctic climate. https://www.nasa.gov/mission_pages/arctas/summer_deploy.html

National Center for Atmospheric Research. Measuring the Arctic’s haze and smoke. https://opensky.ucar.edu/islandora/object/archives%3A4922/datastream/OBJ/view

Quinn, P. K., G. Shaw, E. Andrews, E. G. Dutton, T. Ruoho-Airola, and S. L. Gong. 2007. Arctic haze: current trends and knowledge gaps. Tellus B 59:1, 99−114.

For more information

NASA Atmospheric Science Data Center (ASDC)

NASA Global Hydrometeorology Resource Center Distributed Active Archive Center (GHRC DAAC)

Arctic Research of the Composition of the Troposphere from Aircraft and Satellites (ARCTAS) Data at ASDC

ARCTAS Mission Page

NASA Real Time Mission Monitor (RTMM)

NASA Research Environment for Vehicle Embedded Analysis

National Center for Atmospheric Research (NCAR) Atmospheric Chemistry Division

About the data
Sensors Various airborne sensors
Data sets Arctic Research of the Composition of the Troposphere from Aircraft and Satellites (ARCTAS): DC-8 aircraft data P-3B aircraft data B200 aircraft data
Resolution Various
DAAC NASA Atmospheric Science Data Center (ASDC)
About the data tool
Tool Real Time Mission Monitor
Products provided Simultaneous aircraft tracking for the NASA DC-8, P-3B, and B200 Satellite imagery, aircraft state information, and surface data sets
DAAC NASA Global Hydrometeorology Resource Center Distributed Active Archive Center (GHRC DAAC)

Details

Last Updated

Published

Data Center/Project

Atmospheric Science Data Center (ASDC)
Global Hydrometeorology Resource Center DAAC (GHRC DAAC)