New Features in Giovanni

The release of Giovanni Version 4.28 by NASA’s GES DISC brings improvements and enhancements to this data visualization and analysis application.

NASA’s Goddard Earth Sciences Data and Information Services Center (GES DISC) released a new version of the Giovanni data visualization and analysis application. The web-based Giovanni provides a simple and intuitive way to visualize, analyze, and access vast amounts of Earth science remote sensing data without having to download the data.

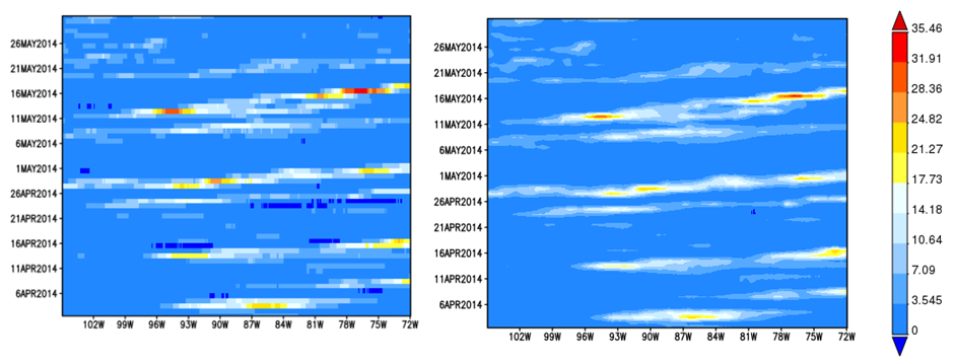
Comparison of Hovmoller discrete pixel display vs. contoured output.
Image Caption

Comparison of Hovmöller plots showing daily averaged precipitation (combined microwave-IR) estimate for April 1 through May 31, 2014, in discrete pixel display (left) and contoured output in Giovanni V4.28 (right). Illustration created using data from the joint NASA/JAXA GPM mission and courtesy of NASA’s GES DISC.

New features in Giovanni V4.28 include:

  • Hovmöller plots are now shown with contoured output, rather than a discrete pixel display (see image);
  • The Help and Feedback buttons have been integrated with the Giovanni toolbar, making the user interface easier to navigate;
  • Bounding box input can now be cleared within the map selection tool; and
  • Data grid information has been added to the caption for non-shapefile cases (this data grid information also is found in the comma-separated values [CSV] output file).

GES DISC is the Earth Observing System Data and Information System (EOSDIS) Distributed Active Archive Center (DAAC) responsible for a wide range of global climate data, primarily in the areas of atmospheric composition, atmospheric dynamics, global precipitation, and solar irradiance. It is located at NASA’s Goddard Space Flight Center in Greenbelt, MD.

Details

Last Updated

Published

Data Center/Project

Goddard Earth Sciences Data and Information Services Center (GES DISC)