A simple-to-use mapping tool at NASA’s Socioeconomic Data and Applications Center (SEDAC) shows both demographic data along with regularly updated information about reported global cases of the disease caused by the novel coronavirus (COVID-19). The Global COVID-19 Viewer: Population Estimates by Age Groups and Sex is unique in its ability to allow users to visualize age and sex data for any area, including areas that cut across country boundaries, through simple age-and-sex structure charts or age pyramids.
NASA SEDAC Application Puts Current Global COVID-19 Data at Your Fingertips
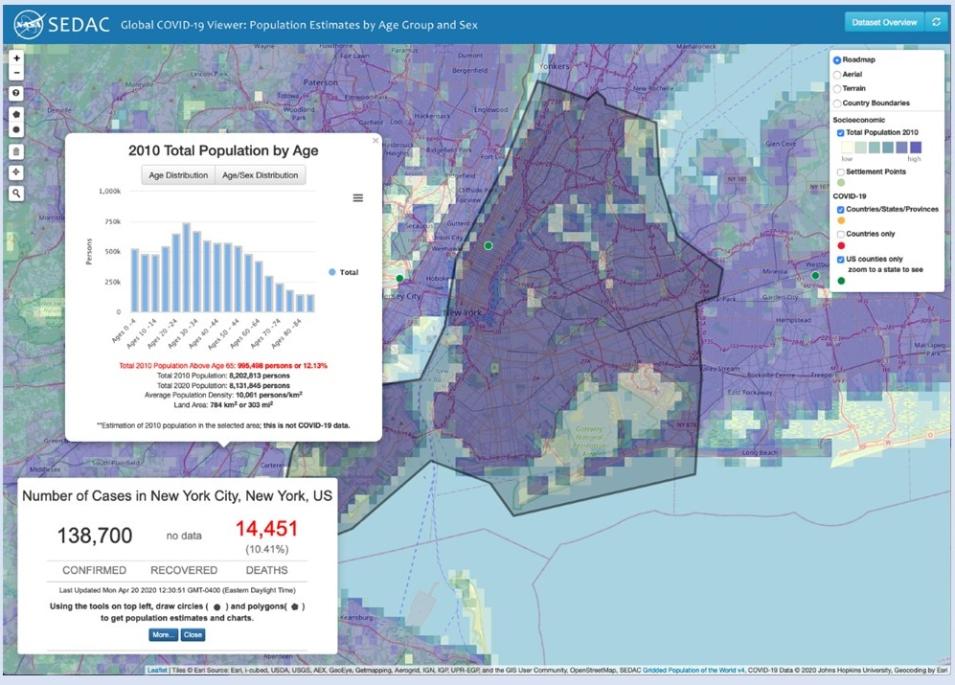
Screenshot from the Global COVID-19 Viewer showing Johns Hopkins University & Medicine Coronavirus Resource Center COVID-19 data for New York City as of 12:30 pm, EDT, on April 20, 2020. A table showing population demographics from SEDAC’s GPW Basic Demographic Characteristics dataset for the area within the dark polygon on the base map is displayed above the COVID-19 data. The high percentage of the population in the working age groups (20-40 years of age; longer blue bars in population table) and the relatively small percentage of population above age 65 (about 12 percent) are features of New York City’s demographic profile. Control panel in upper right enables users to pick and choose base map and population displays as well as the spatial range of COVID-19 data (shown as colored dots). Click on image for larger view. NASA SEDAC image.
“We recognized that SEDAC has a unique set of data resources that are relevant to the COVID-19 pandemic, and that epidemiological modelers are using our global spatial population data to understand how rapidly the virus may spread,” says Dr. Alex de Sherbinin, deputy manager of NASA’s SEDAC. “Early on it became apparent that the elderly—namely people above age 65—were particularly at risk from the virus. We modified an existing SEDAC capability, the Population Estimation Service, which allows users to see the age structure of the population, to bring in data from Johns Hopkins on COVID-19 cases and mortality into a unique and simple interface.”
Designed primarily for researchers, educators, and decision makers, the COVID-19 Viewer shows demographic data from SEDAC’s Gridded Population of the World (GPW) Basic Demographic Characteristics, v4.11 along with regularly-updated COVID-19 information from the Johns Hopkins University and Medicine Coronavirus Resource Center. The demographic data are separate from the COVID-19 data and do not represent COVID cases per se. Rather, the demographic data enable users to see the population distribution of different demographic groups and help identify susceptible populations. “The information in the Viewer is relevant to anyone, but could be particularly relevant to public health and local decision makers,” says de Sherbinin.
At the click of a button, users of the COVID-19 Viewer can receive global information compiled by the Johns Hopkins University & Medicine Coronavirus Resource Center about the number of confirmed COVID-19 cases, the number of people who have recovered from COVID-19, and the number of deaths attributed to COVID-19 for specific countries and, where available, sub-national areas (such as states or provinces). Users also can generate separate population estimates for defined areas of interest. The population data are for the year 2010, with estimates to 2020, and are derived from global census data and population registers.
Demographic data in the Viewer are from SEDAC’s GPW Basic Demographic Characteristics dataset. When a circle or polygon is drawn, a box showing demographic data by age or by sex for the selected area appears. A buffer tool is available to generate population estimates and charts using specific latitude/longitude coordinates.
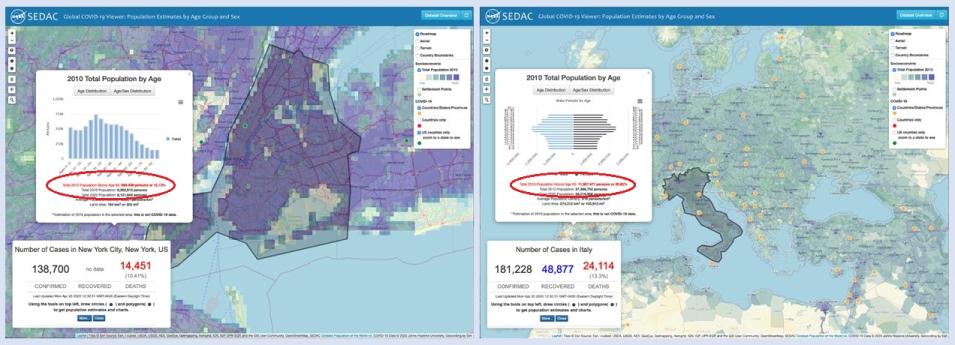
COVID-19 data for New York City (left image) and for Italy (right image) as of 12:30 pm, EDT, on April 20, 2020. The New York City image shows an age distribution table; the image for Italy shows an Age/Sex Distribution pyramid. Red text below demographic data in both images (circled in red) highlights Total 2010 Population Above Age 65, an age demographic that has been determined to be more susceptible to severe COVID-19 health impacts. NASA SEDAC image.
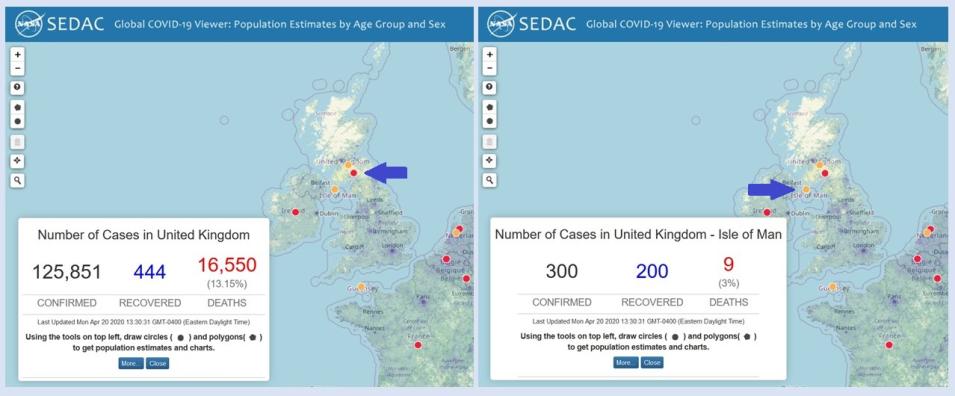
Screenshot from the SEDAC Global COVID-19 Viewer acquired at 1:30 pm, EDT, on April 20, 2020, showing the differences between selecting Red (Countries Only) COVID-19 data (left image, blue arrow) versus the Yellow (Countries/States/Provinces) COVID-19 data (right image, blue arrow). Click on image for larger view. NASA SEDAC image.
Upon launching the application, users see a map of the world with colored circles indicating areas with available COVID-19 data. The color of the circle represents the spatial extent of the COVID-19 data displayed: Yellow = COVID-19 cases in countries/states/provinces; Red = COVID-19 cases by countries only; Green = COVID-19 cases in U.S. counties (U.S. county data are displayed only when the map is zoomed in on the U.S.). Clicking on a colored circle brings up a box displaying the most recently updated COVID-19 Johns Hopkins Coronavirus Resource Center data for the country, state, province, or U.S. county selected.
SEDAC is the NASA Earth Observing System Data and Information System (EOSDIS) Distributed Active Archive Center (DAAC) responsible for archiving and distributing socioeconomic data in the EOSDIS collection, and is hosted at Columbia University’s Center for International Earth Science Information Network (CIESIN). SEDAC synthesizes Earth science and socioeconomic data and information in ways useful to a wide range of decision makers and other applied users, and serves as an “Information Gateway” between the socioeconomic and Earth science data and information domains.
The underlying data from the Global COVID-19 Viewer are available through open data services that other groups are free to use in their own COVID-19 applications and viewers. SEDAC is currently working with a number of groups to expand the range and accessibility of relevant socioeconomic and remote sensing data and to facilitate their use not only for near-term public health decision making, but also for the medium-term challenge of reopening the world’s economy and dealing with future complex emergencies.
As SEDAC manager and CIESIN director Dr. Robert Chen observes, “Open sharing of data supported by organizations like Johns Hopkins and NASA is vital to improving widespread understanding and effective response to major crises like the COVID-19 pandemic that require data and knowledge from many disciplines and regions.”
Explore the Global COVID-19 Viewer at NASA’s SEDAC: https://sedac.ciesin.columbia.edu/mapping/popest/covid-19/
Published April 23, 2020


