Meeting the Demand for Data on Urban Areas

NASA’s Socioeconomic Data and Applications Center (SEDAC) has released a collection of 12 datasets focused on the urban environment.

According to the United Nations, the world’s urban population has grown rapidly in the past 75 years, increasing from 751 million in 1950 to 4.2 billion in 2018. This growth is driven by an overall increase in the world’s population coupled with a rise in the percentage of people living in urban areas. Together, these two factors are projected to add 2.5 billion to the world’s urban population by 2050, with almost 90 percent of this growth happening in Asian and African cities alone.

These are eye-opening statistics. It is critical for state and local officials, humanitarian organizations, researchers, and others involved with environmental sustainability, public health, and hazard resilience to have accurate fine-scale data on the location, population, and spatial extent of human settlements, as well as an understanding of their vulnerability and assets to mitigate climate impacts.

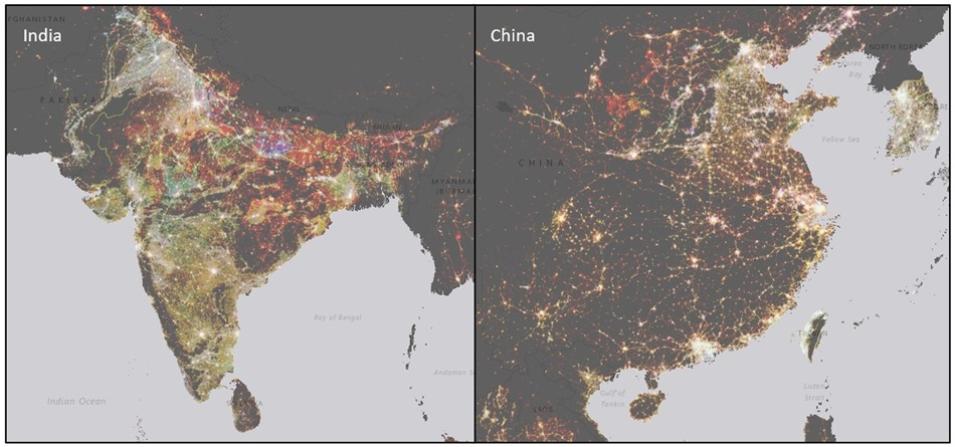
These side-by-side images of India and China show change in nighttime lights data from 1992 to 2013 from SEDAC's VIIRS+DMSP dLIGHT v1 datasets.
Image Caption

These images from NASA's Socioeconomic Data and Applications Center (SEDAC) Visible Infrared Imaging Radiometer Suite (VIIRS) Plus Defense Meteorological Satellite Program (DMSP) Change in Lights (VIIRS+DMSP dLIGHT), v1 (1992, 2002, 2013) dataset show India and China, two of the three countries (along with Nigeria) that are expected to account for 35 percent of the growth in the world’s urban population between 2018 and 2050. The VIIRS+DMSP dLIGHT product visualizes changes in both brightness and extent of nocturnal low lights over two decades. Red areas indicate new lights from 2002 to 2013, green areas represent new lights from 1992 to 2002, blues areas indicate existing nighttime lights in 1992, and white areas represent stable nighttime lights from 1992 to 2013. For a closer look, see the VIIRS Plus DMSP Change in Lights (dLIGHT) 1992, 2002, 2013 map in SEDAC's POPGRID Viewer. Credit: SEDAC

To help decision makers and researchers stay abreast of urban population and environmental characteristics, NASA's Socioeconomic Data and Applications Center (SEDAC) has released a collection of 12 datasets focused on different aspects of the urban environment, such as air quality, extreme heat exposure, population size and location, and progress on sustainable development goals. 

The datasets include:

DatasetDescription
Global Urban Points and Polygons Dataset (GUPPD), Version 1
doi:10.7927/brq1-xc29
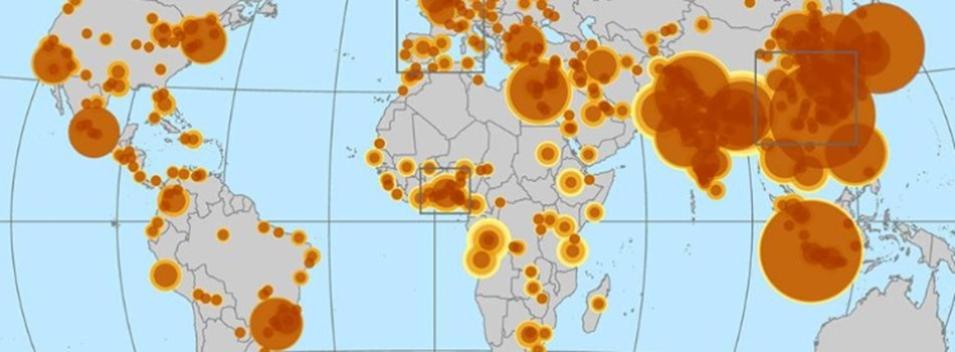
GUPPDv1 is a global dataset of 123,034 urban settlements with place names and population counts for the years of 1975 to 2030 in five-year increments. See graphic below.
Visible Infrared Imaging Radiometer Suite (VIIRS) Plus Defense Meteorological Satellite Program (DMSP) Change in Lights (VIIRS+DMSP dLIGHT), v1 (1992, 2002, 2013)
doi:10.7927/9ryj-6467
This dataset provides a measure of urban change distinct from the population measure of GUPPD, which uses a static definition of city size based on 2015 Global Human Settlement-Settlement Model (GHS-SMOD) definitions.
Global Human Settlement Layer: Population and Built-Up Estimates, and Degree of Urbanization Settlement Model Grid GHS-SMOD
doi:10.7927/h4154f0w
This dataset provides gridded data on human population, built-up area, and degree of urbanization across four time periods: 1975, 1990, 2000, and 2014 (built-up area) or 2015 (human population, degree of urbanization).
Urban Growth Projections to 2030: Global Grid of Probabilities of Urban Expansion to 2030
doi:10.7927/H4Z899CG
This dataset presents spatially explicit probabilistic forecasts of global urban land cover change from 2000 to 2030 at a 2.5 arc-minute resolution.
Global One-Eighth Degree Urban Land Extent Projection and Base Year Grids by SSP Scenarios, 2000-2100
doi:10.7927/nj0x-8y67
This dataset consists of global Shared Socioeconomic Pathway (SSP)-consistent spatial urban land fraction data for the base year 2000 and projections at 10-year intervals for 2010-2100 at a resolution of one-eighth degree (7.5 arc-minutes).
Global Rural Urban Mapping Project (GRUMP): Urban Extents and Settlement Points
doi:10.7927/H4GH9FVG
This dataset, which has been superseded by the GUPPD data set (above), was the first global spatial data set with named settlements and populations using consistent globally gridded data inputs. Urban areas are defined using a combination of nighttime lights and buffered settlement points.
Global High Resolution Daily Extreme Urban Heat Exposure (UHE-Daily), 1983-2016
doi:10.7927/fq7g-ny13
This dataset contains a high-resolution, longitudinal global record of geolocated urban extreme heat events (UHE) and urban population exposure estimates for more than 10,000 urban settlements worldwide for the years 1983 to 2016.
Yale Center for Earth Observation (YCEO) Surface Urban Heat Islands, Version 4, 2003-2018
doi:10.7927/s5m5-zk14
This dataset includes annual, summertime, and wintertime Surface Urban Heat Island (SUHI) intensities for daytime and nighttime for over 10,000 global urban extents.
Annual PM2.5 Concentrations for Countries and Urban Areas, 1998-2016
doi:10.7927/rja8-8h89
This dataset consists of mean concentrations of particulate matter (PM2.5) for countries and urban areas around the globe. The PM2.5 data are from the Global Annual PM2.5 Grids from the Moderate Resolution Imaging Spectroradiometer (MODIS), Multi-Angle Imaging SpectroRadiometer (MISR), and Sea-viewing Wide Field of View Sensor (SeaWiFS) Aerosol Optical Depth (AOD) with Geographically Weighted Regression (GWR) from 1998 to 2016. The urban areas are from the Global Rural-Urban Mapping Project, Version 1 (GRUMPv1): Urban Extent Polygons, Revision 02, and its time series runs from 1998 to 2016.
Annual Mean PM2.5 Components (EC, NH4, NO3, OC, SO4) 50m Urban Area Grids for Contiguous U.S., 2000-2019 v1 (US-specific)
doi:10.7927/wj3-en73
This dataset contains annual predictions of the chemical concentrations of elemental carbon (EC), ammonium (NH4), nitrate (NO3), organic carbon (OC), and sulfate (SO4) concentrations at a hyper resolution (50-meter (m) x 50m grid cells) in urban areas and at a high resolution (1-kilometer (km) x 1km grid cells) in non-urban areas from 2000 to 2019.
Social Development Goal (SDG) Indicator 11.7.1: Urban Public Space, Availability and Access, 2023 Release
doi:10.7927/eavc-4k45
This dataset, which is part of the Sustainable Development Goals Indicators (SDGI) collection, measures the average share of the built-up area of a city that is open space for public use for all.
SDG Indicator 11.2.1: Urban Access to Public Transport, 2023 Release
doi:10.7927/1a5z-3h71
This dataset, also part of the SDGI collection, measures the proportion of the population in a city that has convenient access to public transport. (The United Nation’s SDG 11 is "make cities and human settlements inclusive, safe, resilient and sustainable.")
This map of the world shows data from SEDAC's Global Urban Polygons and Points Dataset (GUPPD), Version 1 dataset.
Image Caption

This graphic shows data from SEDAC's Global Urban Polygons and Points Dataset (GUPPD), Version 1 on a map of the world. Orange circles represent urban settlement population in the year 2015 and yellow circles represent projected population in the year 2030. Credit: SEDAC.

Meeting the Demand for Data on Urban Centers

For SEDAC Project Scientist and Columbia University’s Center for Integrated Earth System Information (CIESIN) Research Scientist Susana Adamo, the presentation of these datasets as a collection is significant, as it showcases “The concept of urban and the notion that there are many layers to city life, as the datasets in this collection point to different ways of thinking about urban environments.”

The collection provides a way for SEDAC to meet the needs of users investigating the attributes and impacts of urban centers, and on urban centers, around the globe.

“There is a demand among users for information on urban centers and on how urbanization impacts natural systems, but a lot of existing datasets are region or country specific,” said CIESIN Senior Research Staff Assistant Juan Martinez. “The datasets in this collection provide that information for urban areas and most have global coverage.” 

In addition, there are datasets in this collection that provide fine-scale (i.e., 100x100m grid resolution) data that decision-makers can apply at the local level.

“Traditionally we’ve had a lot of 1-kilometer grid cell outputs, which don’t give you a whole lot of variation inside of a settlement. There is a push across all data producers, including in SEDAC, to get at that finer scale to make data a little bit more translatable,” said Dana Thomson, CIESIN’s Associate Director for Science Applications. Forthcoming data products in SEDAC’s urban collection will be presented by “city segments, which is just kind of a step up from city block, something similar to a United States census track, and that supports decision-making at the local level.”

This combination of global coverage and finer scale data allows SEDAC to engage different types of users, including enterprise users who are interested in national or international trends, such as progress on sustainable development goals, and so-called last-mile users, whose focus lies at the city or sub-city level.   

“A lot of the enterprise users apply datasets in the urban collection [as] baseline datasets… or as a model input,” Martinez said. “But we also have datasets that are more for the last-mile users, who want data that is ready to use at the local level. The datasets in the urban collection can be used by both these user types because we’re providing these data at a global scale. So, if a user has data specific to their local project, they can pair it with a subset of the data they grab from us and move forward.” 

Investigating the Health and Well-Being of Urban Populations

Given the range of topics they cover and their suitability for different types of users, it's clear that the datasets in SEDAC's urban collection have a variety of applications. In a recent NASA Earthdata webinar, “The Many Layers of City Life: Urban Datasets from NASA's SEDAC,” which in addition to introducing the datasets in SEDAC’s urban collection, showed how researchers are using the datasets in this collection. Some publications cited include:

For Martinez and Adamo, these publications are noteworthy because, in addition to using SEDAC data, they provide examples of how the synthesis of Earth science and socioeconomic data can be used to provide actionable information to decision-makers working to address real-world concerns.
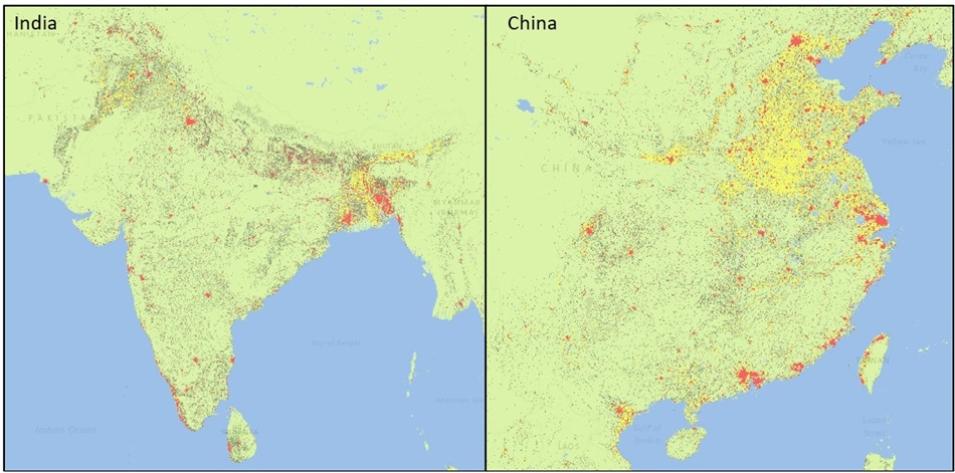
These graphics from SEDAC’s POPGRID Viewer Tool show GHS-SMOD data for India, and China.
Image Caption

These graphics from SEDAC’s POPGRID Viewer show GHS-SMOD data for India, and China. This dataset provides gridded data on human population, built-up area, and degree of urbanization across four time periods: 1975, 1990, 2000, and 2014. Red areas indicate urban centers, yellow indicates suburban and lower density urban areas, and green indicates low density. To get a closer look, see the Degree of Urbanization (GHS-SMOD) 2015 r2019 map in POPGRID Viewer. Credit: SEDAC

Forthcoming Urban Datasets

In addition to the 12 datasets listed above, SEDAC will add two new datasets to the urban collection later this year that provide information about the environmental risks and vulnerabilities within cities and identify slums, informal settlements, or less-accessible areas inside larger urban areas.

The first is a collection of City and Sub-City Datasets on Urban Climate Vulnerability and Risk that will classify environmental vulnerability and risks for 11,422 cities in 2025 Global Human Settlement Layer Urban Centers Database. This dataset will include characteristics for each city (e.g., location, population density, etc.), information on current environmental vulnerabilities, and future climate risks. The sub-city data will feature 500x500-meter grids with high-resolution environmental variables and classifications, environmental vulnerability (current and future), and include more granular data (e.g., percentage of population at risk, vulnerability ratings).

The second is a Socioeconomic Vulnerability in City Segments dataset that will allow users to identify city segments with high population density and limited road connectivity to the rest of the city based on open-source, global data. This dataset can support the monitoring of SDG 11.1.1 by calculating a proxy for the percentage of urban populations living in slums, informal settlements, or inadequate housing.

For Dana Thomson, the addition of these fine-scale data will be a significant complement to SEDAC’s collection of urban datasets. 

“Ninety percent of the people being added to the planet through 2050 are going to live in African and Asian cities alone, and an overwhelming majority will probably live in the poorest areas of those cities, and we have no maps. We have no way of knowing where those slums are,” she said. “But this isn’t just about slum mapping. It really provides a way of thinking about all of the characteristics that define urban poverty and the expressions of poverty in different contexts.” 

These datasets, in conjunction with the 12 aforementioned datasets in the urban collection, also demonstrate how SEDAC’s work supports NASA’s Earth Science to Action initiative, which aims to provide the data, models, resources, and tools required to help decision and policy makers around the globe implement science-based actions on behalf of their communities.

“A lot of NASA’s [Distributed Active Archive Centers] (DAACs) receive foundational data directly from satellites or other instruments and process them into useful datasets, so most [DAACs] are working on this foundational knowledge level,” Thomson said. “SEDAC really sits at the next level of integrating datasets, making sense of things, translating indicators into something that's interpretable by decision-makers and real people on the ground in communities and cities.”

Data Access

NASA Earthdata Search

SEDAC Data Access and Tools

Details

Last Updated

Published