Chaitén speaks
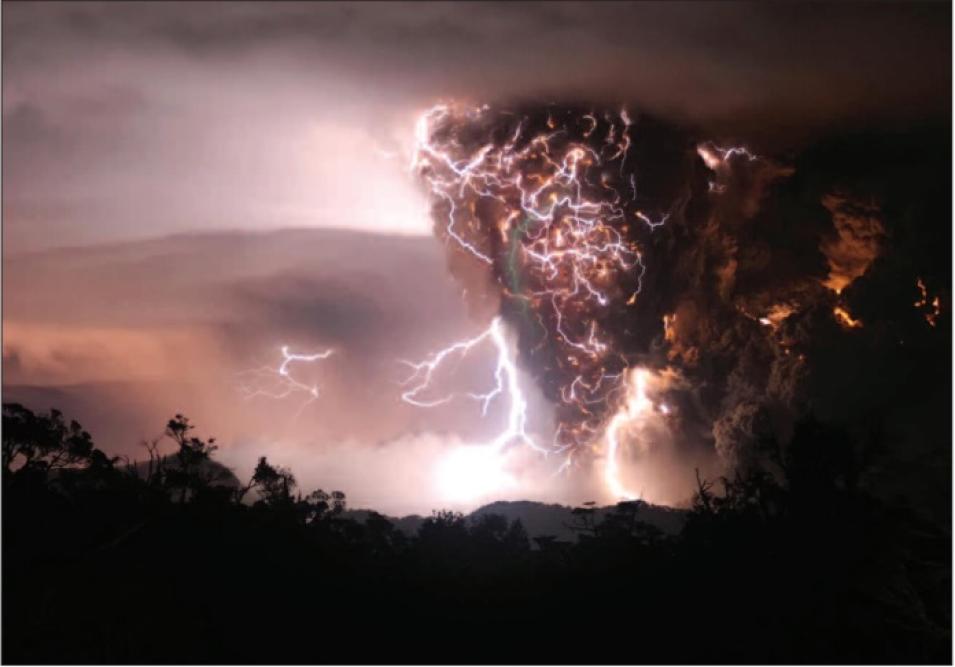
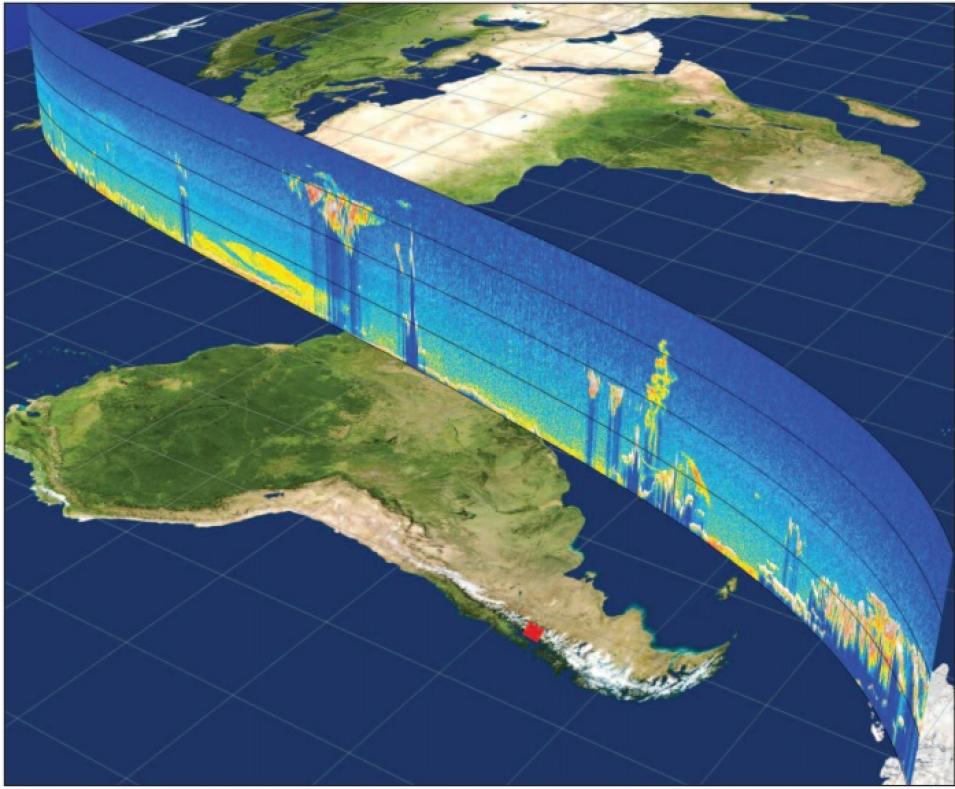
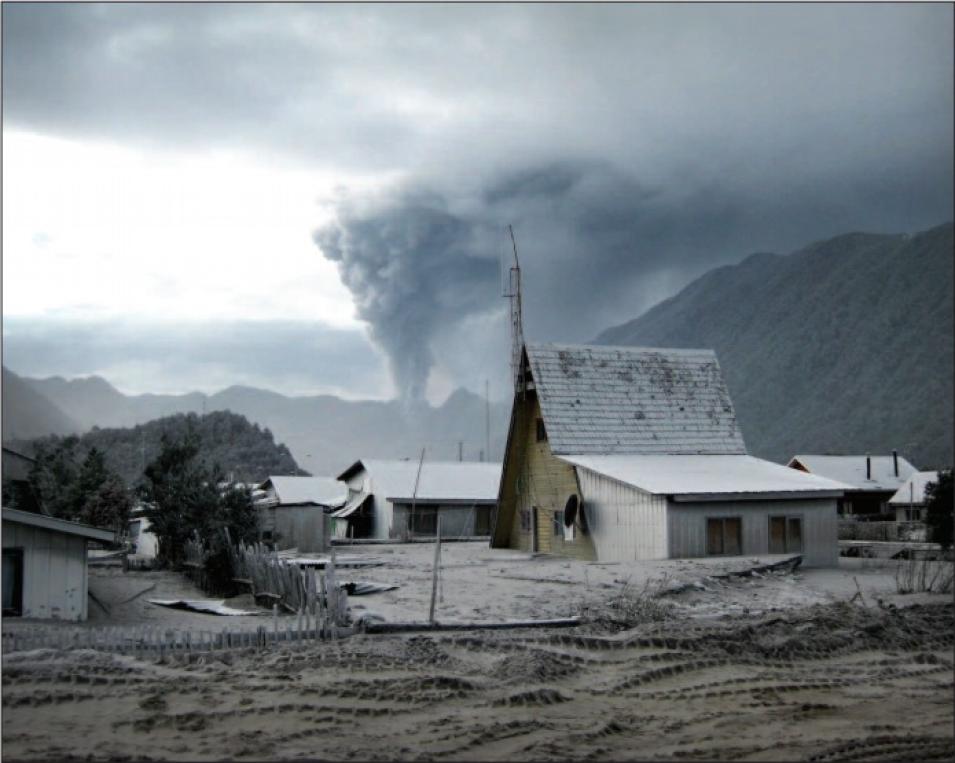
Chaitén was one of the most intriguing eruptions observed with the A-Train. The first of three explosions occurred on May 2, 2008, sending up a tall, visible plume of ash and smoke. On May 3 and 4, both CALIOP and OMI detected aerosols at 12 kilometers (7.5 miles) altitude; OMI detected sulfur dioxide, while CALIOP sensed solid particles from the fine volcanic ash and ice crystals in the plume. A second, larger explosive eruption occurred on May 6, emitting a cloud that drifted east and deposited ash over a large swath of Argentina. On May 8, CALIOP detected aerosols at 18 to 20 kilometers (11 to 12 miles) altitude. And on May 8, a third eruption produced aerosols, detected by CALIOP on May 9 at an altitude of 13 kilometers (8 miles). CALIOP later detected aerosols from Chaitén in the stratosphere, drifting over southeastern Australia, suggesting long-range transport of fine ash.
Researchers watched the eruption’s atmospheric effects unfold in the A-Train data, as the plume drifted, and as sulfur dioxide gases combined with water in the upper atmosphere to create sulfuric acid aerosols. Fromm said, “We were having e-mail discussions while watching Chaitén over a month. Aerosols began to show up the first day, and each and every day more showed up. When you would have expected ash to go away, we were seeing very strong layers over the Southern Hemisphere. It gave us a new understanding that aerosols formed much more quickly and persisted longer than we had previously thought.”
More importantly, while volcanic eruptions normally emit high levels of sulfur dioxide, OMI measured strikingly low sulfur dioxide emissions during the three eruptions, due to the composition of the lava. The OMI data promise to help distinguish the sulfur dioxide-heavy eruptions that can affect climate from eruptions such as Chaitén, thought to have little climate impact in spite of its size.
Data for climate studies
Fromm and Carn continue to study the A-Train data. Fromm said, “It is too soon to say how much climate impact these particular eruptions had, but we have a much better understanding of how frequently these eruptions occur, and a new understanding of the types of gases and particles they produce.” The data are valuable for testing and refining computer models that simulate eruptions and inform climate models. Carn said, “Now we can do a much better job of assessing the role that volcanoes play in global climate. An eruption like this is a rare event, a test we can use on climate models that are designed to predict how the climate will react. Working with these data in the models tells us how well the climate models work.”
Fromm said, “I continue to monitor the A-Train for new events, because each one brings new surprises. I’m keeping an open mind. We still don’t quite have all of the questions answered.”
References
Carn, S. A., A. J. Krueger, N. A. Krotkov, K. Yang, and K. Evans. 2008. Tracking volcanic sulfur dioxide clouds for aviation hazard mitigation. Natural Hazards, doi:10.1007/s11069-008-9228-4.
Carn, S. A., J. S. Pallister, L. Lara, J. W. Ewert, S. Watt, A. J. Prata, R. J. Thomas, and G. Villarosa. 2009. The unexpected awakening of Chaitén volcano, Chile. Eos Transactions, American Geophysical Union 90(24): 205−206.
Prata, A. J., S. A. Carn, A. Stohl, and J. Kerkmann. 2007. Long range transport and fate of a stratospheric volcanic cloud from Soufrière Hills volcano, Montserrat. Atmospheric Chemistry and Physics 7: 5093−5103.
For more information
NASA Atmospheric Science Data Center (ASDC)
NASA Goddard Earth Sciences Data and Information Services Center (GES DISC)
NASA Level-1 and Atmosphere Archive and Distribution System Distributed Active Archive Center (LAADS DAAC)
| About the remote sensing data |
| Satellites |
Aura |
Aqua |
Aqua |
Cloud-Aerosol Lidar and Infrared Pathfinder Satellite Observations (CALIPSO) |
| Sensors |
Ozone Monitoring Instrument (OMI) |
Atmospheric Infrared Sounders (AIRS) |
Moderate Resolution Imaging Spectroradiometer (MODIS) |
Cloud-Aerosol Lidar with Orthogonal Polarization (CALIOP) |
| Data sets |
OMI/Aura Near-UV Aerosol Optical Depth and Single Scattering Albedo |
AIRS IR geolocated radiances |
Level 1B Calibrated Radiances (MOD021KM) |
CALIPSO Lidar Level 2 Vertical Feature Mask data |
| Resolution |
13 x 24 kilometer |
13.5 kilometer |
1 kilometer |
30 to 180 meter vertical;
333 to 1667 meter horizontal |
| Parameters |
Aerosol optical depth |
Radiance |
Radiance |
Aerosol backscatter |
| DAACs |
NASA Goddard Earth Sciences Data and Information Services Center (GES DISC) |
NASA GES DISC |
NASA Level-1 and Atmosphere Archive and Distribution System Distributed Active Archive Center (LAADS DAAC) |
NASA Atmospheric Science Data Center (ASDC) |


