Data Tool in Focus: POPGRID Viewer

The POPGRID Viewer tool demystifies the process of finding the right population dataset.

For disaster response teams eager to assist areas impacted by severe storms, earthquakes, or floods, or aid organizations engaged in efforts like providing insecticide-treated bed nets to people living in remote areas prone to malaria, accurate population counts are critical for successful outcomes.

Traditionally, these counts are derived from census data. However, infrequent intervals of data collection, inaccessibility to certain geographic locations, and resource constraints sometimes leave people uncounted in the total population estimates. Furthermore, countries may only release census data aggregated to large administrative units.

Over the past two decades, high-resolution satellite imagery, Geospatial Information Systems (GIS), and improvements in remote sensing capabilities have spurred the creation of several gridded population datasets that more accurately map population distribution. Moreover, in some cases data producers may fill data gaps by estimating the population of settlements based on the number of dwelling units that are observed. Yet, because these datasets use different inputs and methodologies, they can confuse users who may not fully understand the impact of their differences and lead users to overlook the dataset that might best meet their unique needs.

POPGRID Viewer, a mapping tool that facilitates direct comparison of population and settlement datasets derived from different data sources and methodologies and is available through NASA's Socioeconomic Data and Applications Center (SEDAC), was created to help alleviate these issues.

“The POPGRID Viewer supports the idea that users need more comparable and more easily accessible information about the alternative gridded data products, as well as easier ways to visualize and compare the different data without having to separately download each dataset themselves,” said Dr. Robert Chen, former SEDAC manager.
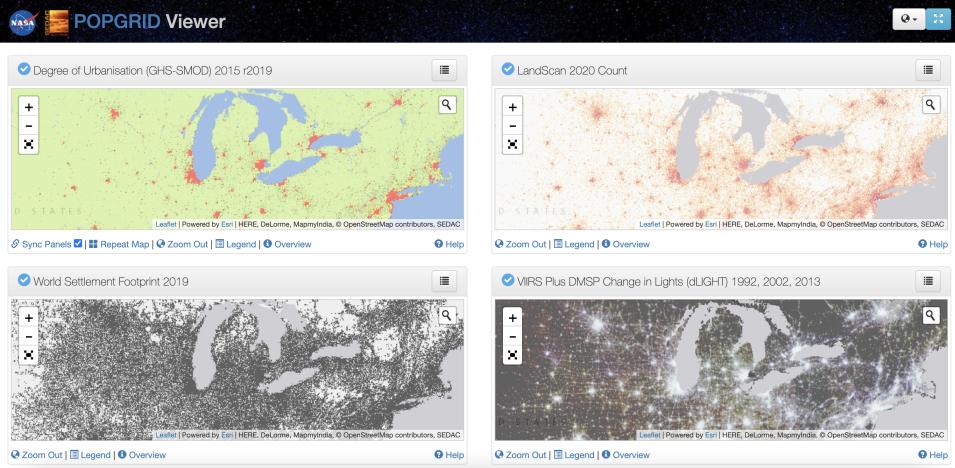
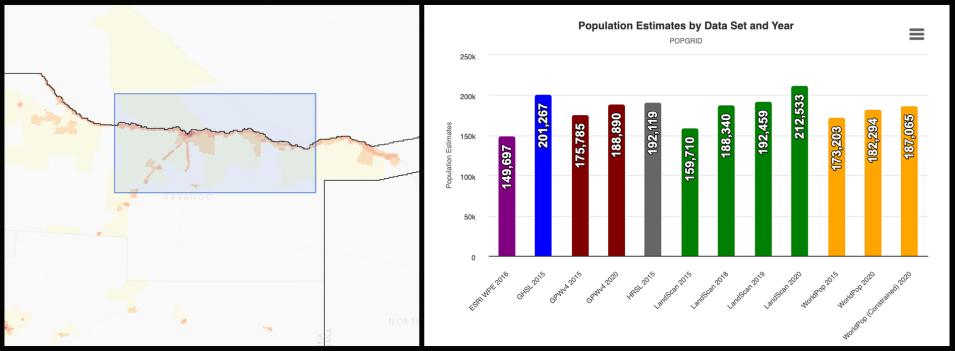
image showing four screens as a grid with earth image data
Image Caption

The Four-Panel Viewer option in SEDAC’s POPGRID Viewer enables users to view four linked windows at once to compare datasets side by side and view pixel values. Shown here are datasets pertaining to urbanization (top left), population (top right), settlement (bottom left), and nighttime lights (bottom right) in the U.S. Great Lakes region. Credit: NASA's SEDAC.

POPGRID informs users about potential variation and uncertainty in estimates of population and settlement distribution in specific areas, helping them determine which datasets or combination of datasets are most suitable for their specific needs. It was developed by SEDAC under the auspices of the POPGRID Data Collaborative, which works to advance the use and impact of geospatial population and infrastructure data by uniting the international community of data providers, users, and stakeholders to accelerate the development and use of high quality, georeferenced data on population, human settlements, and infrastructure.

“In the past 10 or 15 years there have been a lot of groups that have started to produce various [population and settlement] datasets, so there was kind of this acknowledgement that the users needed some guidance,” said Kytt MacManus, a SEDAC geographic information specialist and systems engineer. “We understood that certain datasets would be fit for use for certain purposes, but there wasn’t a lot of good information out there for users to figure that out. So, Dr. Chen started the data collaborative to address the need for more collaboration among the groups that are producing population data, but really with a focus on communicating to users which dataset is fit for use when.”

The POPGRID Viewer offers this information by letting users compare 14 population and 10 settlement layers in two ways: via the tool’s Four-Panel Viewer or with its Single-Panel Comparison View.

The Four-Panel Viewer allows users to:

  • Compare different datasets for specific regions of interest
  • Compare the same dataset at different locations or time periods
  • Zoom in on areas of interest while also keeping a view of the larger context
  • Perform combinations of the three above functions

In contrast, the tool’s Single-Panel Comparison View gives users the option of defining an area of interest by drawing a polygon or rectangle to obtain estimates of the total population in that area based on all available population sources for all available years. This feature also lets users upload their own shapefiles and get population estimates for the areas contained in them.

image showing population data for Kavanga, Namibia
Image Caption

This Single-Panel Comparison View image features population data for the highlighted region of Kavango in eastern Namibia (left side) along with various options for datasets with population estimates (right image). Credit: NASA's SEDAC.

"The [Comparison Viewer] lets users see one dataset at a time but allows spatial queries,” said SEDAC Manager Dr. Alex de Sherbinin. “Users can designate a square or a polygon and then it returns the population estimates within that user-defined area across all the gridded products, giving users a sense of the uncertainty level in the estimates that are available for that area.”

Giving users such insights is key to helping them make informed decisions about the data at their disposal.

“Once a user defines his or her area of interest, [POPGRID] queries against all of these different population datasets and provides a bar chart that shows the variance in the [population] estimates,” said MacManus. “It also includes layers of metadata, like when the most recent census occurred, the spatial resolution of the input data used in that census, and settlement data.”

It is this combination of the application’s functionality and metadata for each dataset that make POPGRID useful for those engaged in disaster response, public health interventions, and other endeavors that require reliable assessments of local populations.

“POPGRID won’t tell you that this is the final [population] number, but it will give you a sense of the accuracy within the numbers that you have,” said de Sherbinin. “Having an idea of what the population is on the ground, within certain margins of error, is useful. If the margins are high, they suggest you might need to invest more resources in getting actual, on-the-ground data, such as sample surveys and other efforts to estimate populations more accurately.”

And this, ultimately, is what makes POPGRID significant for the international geospatial population data community.

“In an increasingly data-rich world, the scientific community is able to produce multiple datasets using innovative methods in response to specific scientific or user needs,” said Chen. “But this proliferation of seemingly similar datasets can cause confusion among users who may not fully understand the differences between the data and methods, and therefore not use the data most suitable to their needs.”

Access POPGRID Viewer

On the SEDAC website, click the “Mapping Tools” link in the pull-down menu under the word “MAPS” along the top of the home page. Users can also access the POPGRID Viewer by clicking on the “Explore Data” tab on the POPGRID Data Collaborative website.

Resources

The POPGRID Data Collective website includes a variety of useful information, including:

Details

Last Updated

Published

Data Center/Project

Socioeconomic Data and Applications Center (SEDAC)