Crisis in the Crescent

Drought turns the Fertile Crescent into a dust bowl.

The Tigris and Euphrates Rivers tumble down the mountains of Turkey, crossing Syria and Iraq as they meander toward the Persian Gulf. Together, the rivers irrigate the Fertile Crescent, an arc of rich land that fostered Mesopotamian and Middle Eastern cultures. For thousands of years, through the rise and fall of civilizations, the Fertile Crescent flourished as an oasis of arable land amid bone-dry deserts.

By the twentieth century, however, even this fertile region began to dry out. Much of the Middle East now struggles under the weight of political unrest, warfare, and population pressures that have stressed water supplies. At the same time, rising temperatures and persistent drying are transforming the region’s story from one of richness and fertility to one of sand and dust. Could a concurrence of climate phases coupled with a long-term drought spell the end of the Fertile Crescent? Two scientists approach the problem from opposite directions, only to reach similar conclusions.

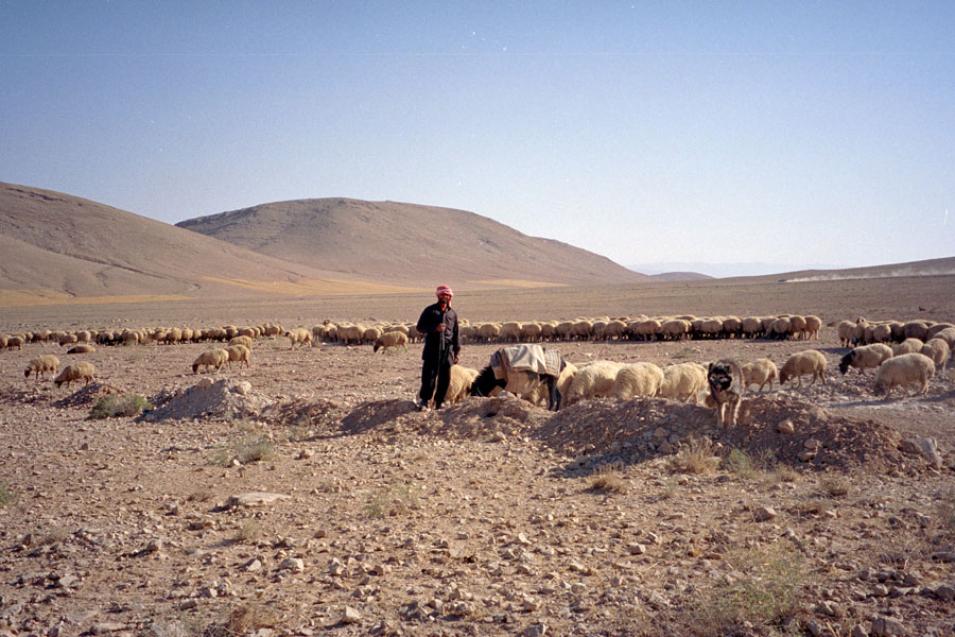
Photograph of a bedouin shepherd in Syria
Image Caption

A Bedouin shepherd tends his sheep amid a parched landscape in Syria. (Courtesy J. Werner)

Dust and drought

Climatologist Colin Kelley was studying rainfall across the Mediterranean when he spotted extensive drought in Syria, at the center of the Fertile Crescent. The drought started in the winter of 2006-2007 and lasted for three years, preceding the 2011 Syrian uprising. Kelley pivoted to study the Syrian drought. “We wanted to put the drought in context,” he said. This drought followed several multi-year droughts in the 1980s and 1990s, so Kelley wondered if the most recent drought punctuated the drying trend, serving as a catalyst for the uprising.

Even as modernization swept across the Middle East during the twentieth century, agricultural villages and nomadic Bedouin herders relied on rivers and wells to irrigate crops and water herds of sheep and cattle. Between 2006 and 2009, these water sources dried up, forcing farmers and shepherds to abandon their land. In addition, military operations destabilized the Middle East, and by 2010, Syrian cities had absorbed more than one million Iraqi refugees—not insignificant, considering Syria’s 2010 population was 21 million. “Population growth increases the demand for water,” Kelley said. By the 2011 uprising, drought, national policies, and a swelling refugee population had crippled the agricultural economy in Syria.

Kelley and his colleagues searched for evidence among the data. Ground measurements of agricultural production were sparse, so Kelley and his colleagues looked at imagery from the Moderate Resolution Imaging Spectroradiometer (MODIS) sensor on the NASA Aqua and Terra satellites. MODIS can measure the greenness of land surfaces, as a proxy for crops and vegetation. The data revealed a decrease in vegetation abundance during the most recent Syrian drought, beginning in 2006, which corresponded with skyrocketing prices for imported wheat and rice.

But changes on the surface only told part of the story. In addition to irrigation, farmers rely heavily on groundwater. So Kelley also needed to know whether groundwater supplies had been depleted. Again, however, ground measurements were largely unavailable, so Kelley relied on data from the Gravity Recovery and Climate Experiment (GRACE) satellites, which can detect groundwater by measuring small gravity changes. “GRACE measures actual soil moisture as well as subsurface water, including underground aquifers,” Kelley said. GRACE data showed a clear decline in both surface moisture and groundwater supplies.

In addition, historical climate data revealed an unrelenting rise in temperatures across the region, which further dried out the soil and increased evaporation. “When agriculture collapsed in Syria, there was a real dearth of cultivation,” Kelley said. “So all of a sudden, there’s a lot more soil that’s exposed to the wind.” And when the shamal winds sweep in, the deserts take flight.

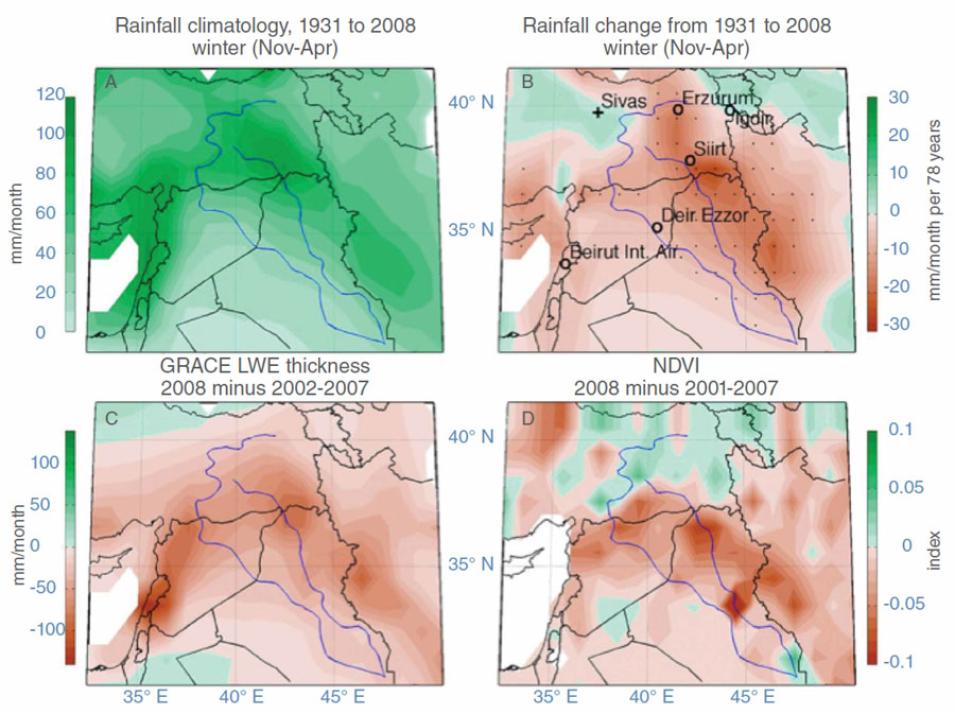
Four maps showing changes in precipitation, winter rainfall, groundwater, and vegetation across the Fertile Crescent between 1931 and 2008
Image Caption

The Fertile Crescent has been steadily drying since 1931, and recent changes have exacerbated the trend. Map A shows winter precipitation from 1931 to 2008. Map B shows winter rainfall change from 1931 to 2008. Map C shows a steep decline in groundwater between 2008 and the mean of the previous six years using data from the Gravity Recovery and Climate Experiment (GRACE) satellites. Map D shows a decline in vegetation between 2008 and the mean of the previous seven years using Normalized Difference Vegetation Index data from the Moderate Resolution Imaging Spectroradiometer (MODIS) satellite instrument. (Courtesy C. P. Kelly, et al., 2015, PNAS)

Dust in the wind

Beginning around 2007, researchers at King Saud University in Saudi Arabia had noticed a distinct uptick in dust storms sweeping across the Arabian Peninsula. To understand the rise, they partnered with climatologist Michael Notaro, who studies vegetation and rain in the context of global climate processes. They hoped he could help them discover the dust’s origin and improve the seasonal predictability of dust activity.

The Middle East is second to the Sahara Desert as a source of sand and dust. Dust storms are nothing new here, but they have become more frequent. In April 2015, a massive dust storm billowed across the Arabian Peninsula, turning bright blue skies an ominous orange. Clouds of sandy grit enveloped entire cities, snarling traffic. Flights to the United Arab Emirates and Qatar had to be diverted or delayed. Schools in Saudi Arabia’s capital, Riyadh, cancelled classes. The storm was so large that it was clearly visible from space.

Two plots mapping dust activity across the Arabian Peninsula between 2001 to 2005 and 2008 to 2012
Image Caption

These plots show the ratio of change in dust activity across the Arabian Peninsula between 2008 and 2012, compared to the time period 2001 to 2005. The blue polygon shows the area of greatest vegetation decline. Data are from the Multi-angle Imaging Spectroradiometer (MISR) satellite instrument. (Courtesy M. Notaro, et al., 2015, Journal of Geophysical Research: Atmospheres)

Notaro and his graduate student, Yan Yu, along with Olga Kalashnikova at NASA's Jet Propulsion Laboratory (JPL) dug into the problem. At first, they discovered that there was little existing research to build on, so they attacked the problem step by step. First, they analyzed observations from ground-based meteorological stations across Saudi Arabia dating back to the mid-1970s. These data revealed that the dusty season tended to run February through June, although dust storms could batter the peninsula well into August.

Next, in collaboration with JPL, they looked at atmospheric dust, available to form these towering storms, using remote sensing. They retrieved data from the Multi-angle Imaging SpectroRadiometer (MISR) instrument on the NASA Terra satellite. MISR can distinguish dust—which typically consists of non-spherical particles—from spherical particles, such as water droplets and other chemical particles in the atmosphere. This helped the researchers coax out an intriguing trend. Consistent between the MISR data and station observations, they discovered anomalously high levels of dust in the atmosphere between 2007 and 2013—coinciding with the most recent drought across the Fertile Crescent.

What caused this change? Were shifting winds kicking up more dust from the same locations, or were newly desertified regions—perhaps those in Syria—adding dust? So the researchers compiled wind trajectories for all past recorded dust events, looking backwards in time to trace where the dust came from. “The Rub’ al Khali Desert in the southern peninsula is a major dust source to the peninsula,” Notaro said. In Arabic, Rub’ al Khali means “empty quarter,” an apt description for one of the world’s largest deserts. But the Rub’ al Khali was not the only source. “There were also some key remote sources of dust from outside of Saudi Arabia,” Notaro said. Although the Sahara Desert to the west contributed dust, the wind trajectories and MISR data both pointed to the north, where the shamal winds—a northwesterly wind from the mountains of Turkey—blew down toward the Tigris and Euphrates River basins across Syria and Iraq. “We ended up with greater dust generation and transport when the northerly winds blew out of the Fertile Crescent to the Arabian Peninsula,” Notaro said.

Once Notaro and his colleagues discovered when dust storms occurred across Saudi Arabia, and where the dust came from, they needed to understand why the storms had rapidly increased. Had something converted the Fertile Crescent into a dust bowl?

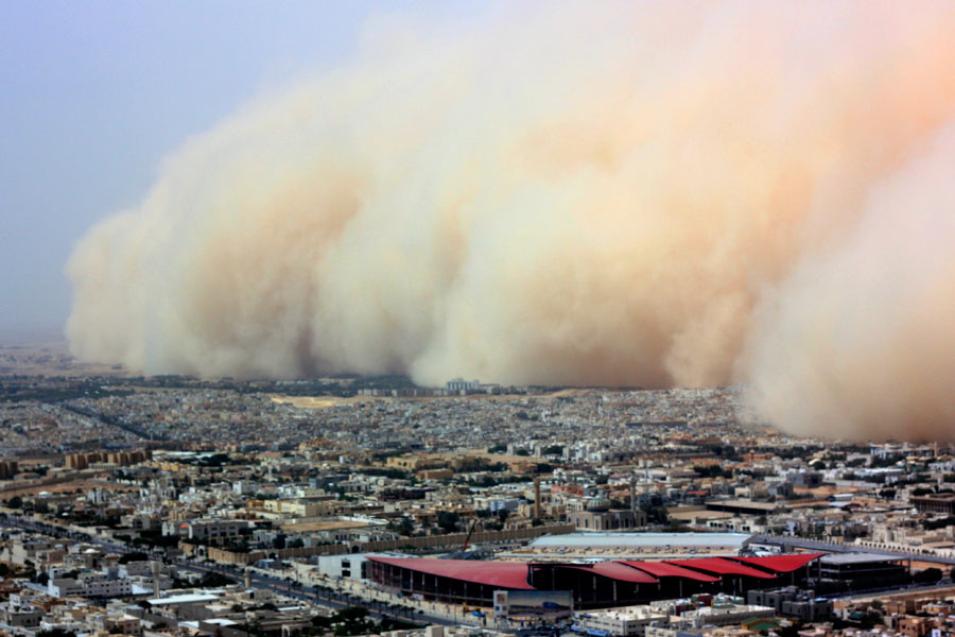
Photograph of a sandstorm in Riyadh, Saudi Arabia
Image Caption

A massive sandstorm engulfs Riyadh, the capital of Saudi Arabia, on March 10, 2009. (Courtesy Associated Press)

A larger climate shift

“Since 1931, the whole Fertile Crescent has been experiencing a drying trend,” Notaro said. Over the course of his research, he had also analyzed MODIS vegetation data for the region, and had become familiar with Kelley’s research. While Kelley zoomed in to investigate groundwater, Notaro zoomed out. He suspected larger-scale climate factors might have helped trigger the drought. In particular, Notaro looked at the El Niño Southern Oscillation (ENSO) and the Pacific Decadal Oscillation (PDO), a similar but longer-term pattern that shifts between warm and cool phases over decades rather than years. When the cool phases of these related patterns are in sync, as occurred during the Fertile Crescent drought, they can amplify changes in precipitation and surface water that lead to drier conditions.

In its positive phase, the PDO can bring more rainfall to the Mediterranean and Middle East. The Tigris and Euphrates Rivers, along with their tributaries, rely almost entirely on winter rainfall. In 2006, the PDO shifted to a negative phase, reducing rainfall across the Fertile Crescent. At about the same time, the ENSO cycle shifted from a wet El Niño phase to a drier La Niña phase. Notaro thinks synergy between the two states may have coincided with the most recent Syrian drought. “There’s a very clear regime shift around 2006,” he said. “When you have both La Niña and a negative PDO, they can reinforce each other.” Indeed, the winter of 2007-2008 proved to be the driest in Syrian climate records.

When the wind trajectory, vegetation, and climate data were compiled, Notaro concluded that the regime shift seemed to be associated not only with drought across the Fertile Crescent, but the increase in dust storms as well. Prior to the Syrian agricultural collapse, the highest levels of atmospheric dust were contained over the Rub’ al Khali Desert. Afterward, high levels of atmospheric dust extended across Syria, Iraq, and northern Saudi Arabia.

Drought, heat, population pressures, and civil unrest spread havoc across the Syrian countryside, driving farmers and shepherds to seek refuge in cities. Less agriculture led to more untended soil, and ultimately, more dust as surrounding deserts closed in. Kelley likened the situation to the 1930s Dust Bowl across the United States prairies. “Why that drought occurred and why this drought occurred is different,” Kelley said. “But what we’re seeing here is similar, so it’s possible that these mega dust storms that occurred in the U.S. during the Dust Bowl may be what we’re starting to see here.”

Natural variations, such as a swing back to wetter phases of PDO and ENSO patterns, may temporarily relieve drought conditions in Syria and reduce dust storms plaguing the Arabian Peninsula. Long-term climate models, however, indicate temperatures in the region will continue to rise, in response to rising levels of greenhouse gases, and the hot, dry trend will continue. Notaro said, “This is all one big story, connecting drought, land use, agriculture, politics, and climate change.”

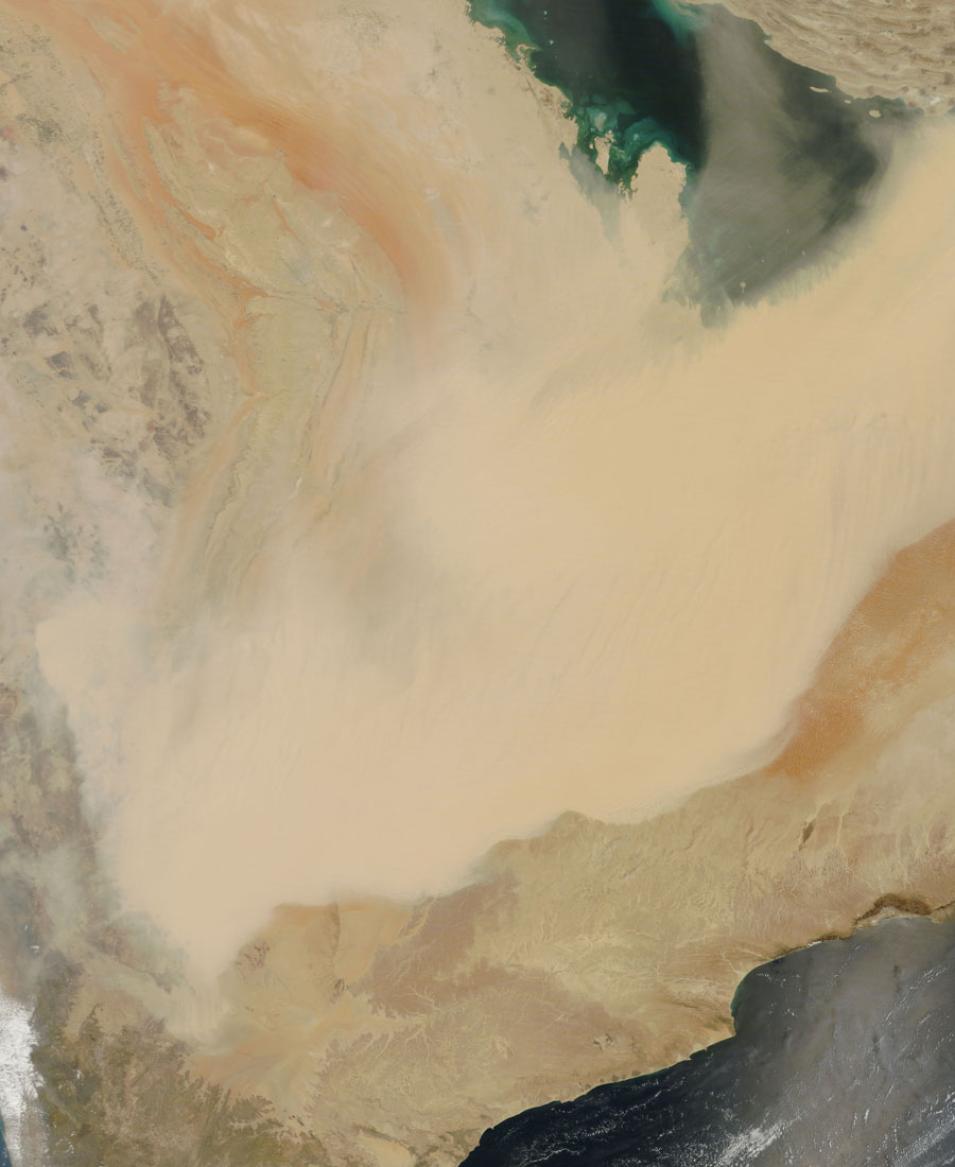
Satellite image showing a sandstorm sweeping across the Arabian Peninsula
Image Caption

The Moderate Resolution Imaging Spectroradiometer (MODIS) satellite instrument captured a dense wall of dust barreling across the Arabian Peninsula on April 13, 2015. (Courtesy Jeff Schmaltz, MODIS Land Rapid Response Team, NASA GSFC)

References

Global Modeling and Assimilation Office (GMAO). NASA Modern Era Retrospective-Analysis for Research and Applications (MERRA). Goddard Earth Sciences Data and Information Services Center (GES DISC), Greenbelt, MD, USA. http://disc.sci.gsfc.nasa.gov/mdisc/data-holdings/merra/merra_products_nonjs.shtml.

Kelley, C. P., S. Mohtadi, M. A. Cane, R. Seager, and Y. Kushnir. 2015. Climate change in the Fertile Crescent and implications of the recent Syrian drought. Proceedings of the National Academy of Sciences of the United States of America 112(11): 3,241–3,246. doi:10.1073/pnas.1421533112.

Levy, R., Hsu, C., et al., 2015. MODIS Atmosphere L2 Aerosol Product. NASA MODIS Adaptive Processing System (MODAPS), Goddard Space Flight Center, USA. doi:10.5067/MODIS/MOD04_L2.006.

MISR Science Team (2015), Terra/MISR Level 3, Component Global Aerosol Monthly, version 4, Hampton, VA, USA: NASA Atmospheric Science Data Center (ASDC). doi:10.5067/Terra/MISR/MIL3MAE_L3.004.

Didan, K. 2015. MODIS Vegetation Indices Monthly L3 Global 0.05Deg CMG. NASA EOSDIS Land Processes DAAC (LP DAAC), USGS Earth Resources Observation and Science (EROS) Center, Sioux Falls, SD (https://lpdaac.usgs.gov), at https://lpdaac.usgs.gov/products/mod13c2v006/.

Notaro, M., Y. Yu, and O. V. Kalashnikova. 2015. Regime shift in Arabian dust activity, triggered by persistent Fertile Crescent drought. Journal of Geophysical Research: Atmospheres 120: 10,229–10,249. doi:10.1002/2015JD023855.

Swenson, S.C. 2012. GRACE monthly land water mass grids NETCDF Release 5.0 NASA Physical Oceanography DAAC (PO.DAAC), CA, USA. doi:10.5067/TELND-NC005.

Vose, R. S., R. L. Schmoyer, P. M. Steurer, T. C. Peterson, R. Heim, T. R. Karl, and J. K. Eischeid. 1998. Global Historical Climatology Network, 1753–1990. NASA Oak Ridge National Laboratory (ORNL) DAAC, Oak Ridge, TN, USA. doi:10.3334/ORNLDAAC/220.

For more information

NASA Atmospheric Science Data Center (ASDC)

NASA Goddard Earth Sciences Data and Information Services Center (GES DISC)

NASA Land Processes Distributed Active Archive Center (LP DAAC)

NASA Level 1 and Atmosphere Archive and Distribution System DAAC (LAADS DAAC)

NASA Oak Ridge National Laboratory DAAC (ORNL DAAC)

NASA Physical Oceanography DAAC (PO.DAAC)

NASA Gravity Recovery and Climate Experiment (GRACE)

NASA Multi-angle Imaging Spectroradiometer (MISR)

NASA Moderate Resolution Imaging Spectroradiometer (MODIS)

Global Historical Climatology Network (GHCN)

NASA Modern-Era Retrospective Analysis for Research and Applications (MERRA)

About the remote sensing data
Satellites Terra Terra and Aqua
Sensors Multi-angle Imaging Spectroradiometer (MISR) Moderate Resolution Imaging Spectroradiometer (MODIS)
Data sets MISR Component Global Aerosol Product MODIS Aerosol Product (MOD04_L2 and MYD04_L2)
Resolution 0.5 degree x 0.5 degree grid 10 x 10 1-kilometer pixel array
Parameters Aerosol optical depth Aerosol optical depth
DAACs NASA Atmospheric Science Data Center (ASDC) NASA Level 1 and Atmosphere Archive and Distribution System Distributed Active Archive Center (LAADS DAAC)
About the remote sensing data
Satellites Terra and Aqua Gravity Recovery and Climate Experiment (GRACE)
Sensors MODIS K-Band Ranging System
Data sets MODIS Vegetation Indices Monthly L3 Global 0.05Deg CMG (MOD13C2) RL05.DSTvSCS1409 GRACE Tellus Monthly Mass Grids – Land
Resolution 0.05 degree (5600-meter) 4,000 x 4,000 kilometer
Parameters Vegetation Gravity
DAACs NASA Land Processes Distributed Active Archive Center (LP DAAC) NASA Physical Oceanography Distributed Active Archive Center (PO.DAAC)
About the data
Platforms Temperature, sea level, and pressure stations
Data sets Global Historical Climatology Network, 1753-1990 NASA Modern Era Retrospective-Analysis for Research and Applications (MERRA)
Resolution 0.5 degree x 0.66 degree grid
Parameters Temperature, precipitation, sea level pressure, and station pressure 850 hPa v-wind, humidity and 500 hPa vertical motion
DAACs NASA Oak Ridge National Laboratory Distributed Active Archive Center (ORNL DAAC) NASA Goddard Earth Sciences Data and Information Services Center (GES DISC)

Details

Last Updated

Published

Data Center/Project

Atmospheric Science Data Center (ASDC)
Goddard Earth Sciences Data and Information Services Center (GES DISC)
Level 1 and Atmosphere Archive and Distribution System DAAC (LAADS DAAC)
Land Processes DAAC (LP DAAC)
Oak Ridge National Laboratory DAAC (ORNL DAAC)
Physical Oceanography DAAC (PO.DAAC)