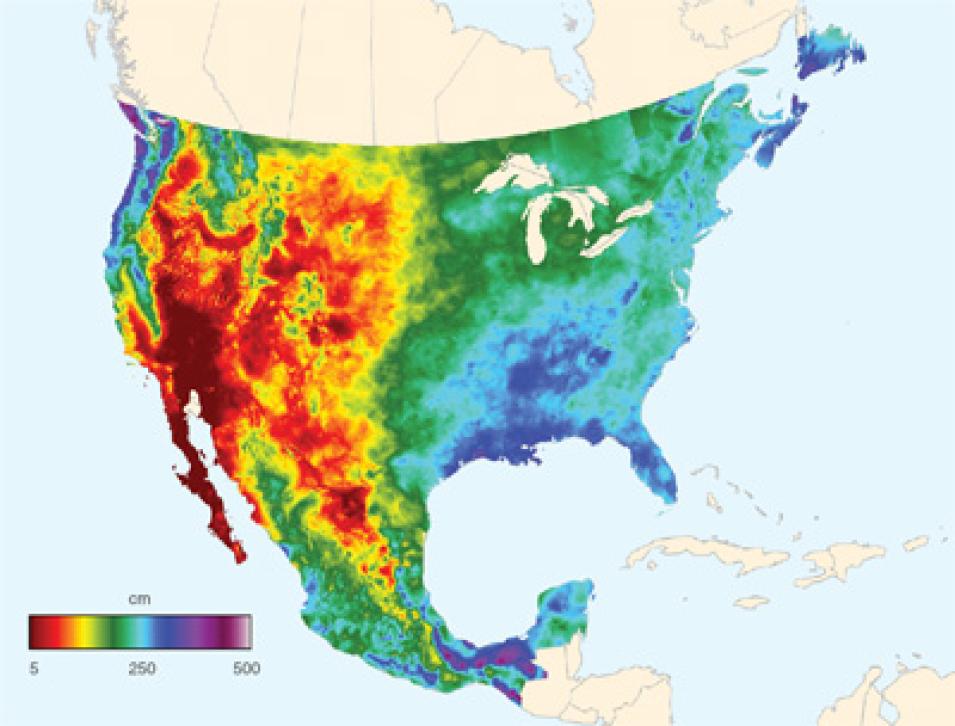
One researcher who knows rainfall is Peter Thornton at the Oak Ridge National Laboratory (ORNL), who developed a data set called Daymet. While working in Montana forests, he and his colleagues were struck by a lack of precipitation and temperature measurements, critical for understanding forest hydrology and productivity. Temperature data are especially helpful for estimating evaporation and transpiration rates. “We needed a way to connect the dots in between measurement stations,” Thornton said.
Thornton realized he could garner observations of temperature and precipitation that were already being made in backyards and back lots across the country, and even in Mexico and Southern Canada. Many of these stations are part of a network of citizen scientists and farmers who monitor conditions on their property using instruments certified by the National Weather Service (NWS). By pulling these together with other national networks, Thornton and his team built an extensive map of ground stations across most of North America.
As a result, Daymet, which is available from NASA's Oak Ridge National Laboratory Distributed Active Archive Center (ORNL DAAC), provides daily readings of rain and snowfall, as well as local temperatures and other meteorological data, such as how wet the soil is, daily humidity, and how much moisture is in the snowpack. “Daymet is the rainfall truth,” Blodgett said. Thornton added, “Anyone can pull these data for their neighborhood to find out what the long-term temperature is like, or the extreme cold temperature in the last thirty years.”
Accounting for ET
Next, Blodgett and his team focused on another major player, evapotranspiration (ET). This is the water lost either through evaporation to the atmosphere, such as through the many tens of thousands of irrigation ditches that cross the country, or through transpiration of plants and trees. For this piece of the hydrologic cycle, they are drawing on both USGS and NASA data.
“We’re using remote sensing to get the big picture and then calibrating the remote sensing with these networks of very high accuracy and very high time resolution,” he said. The ET database was built using Moderate Resolution Imaging Spectroradiometer (MODIS) satellite imagery that is cross-referenced with eddy flux tower data, measurements that tell them how much water moves through the atmosphere versus down through the ground. Combined, these elements—from stream flow to satellite imagery—are providing the most comprehensive picture of water availability to date.
