Collecting Data from the Ground Up: NASA’s Ground Validation Field Campaigns

Ground validation campaigns connect the dots between what is being remotely-sensed by a satellite instrument and ongoing Earth processes.

What do a mule and a DC-8 jet aircraft have in common? Aside from the fact that both can be difficult to manage, mules and NASA’s DC-8 played important roles in the success of the recent Olympic Mountains Experiment (OLYMPEX), ground validation (GV) field campaign. Data from this campaign, conducted November 2015 to February 2016 in remote wilderness areas of Washington State’s Olympic Peninsula, are helping to validate data collected by the joint NASA/Japan Aerospace Exploration Agency Global Precipitation Measurement (GPM) Core Observatory. OLYMPEX data also are providing valuable insights into how complex topography affects mid-latitude precipitation produced in the large storm systems typical of the northeast Pacific Ocean and Pacific Northwest.

Almost 2,500 km southeast of the Olympic Peninsula, in the rolling farmland of Iowa, aircraft and field instruments were used to assess the accuracy of data collected by NASA’s Soil Moisture Active Passive (SMAP) satellite. Results from this May to August 2016 field campaign, called the SMAP Validation Experiment 2016, or SMAPVEX16, are helping improve SMAP’s soil moisture collection algorithms.

OLYMPEX, SMAPVEX16, and similar campaigns are vital components of NASA Earth observing missions. “I use the term ‘Rosetta Stone’ at times to talk about field campaigns,” says Dr. Walt Petersen, the NASA GPM Deputy Project Scientist for Ground Validation. “Like the Rosetta Stone, field campaigns give us the information we need to translate remotely-sensed satellite instrument data into what’s actually being observed on Earth.”

While GV campaigns can take years to prepare and coordinate, the time invested provides a valuable additional source of data about Earth processes and helps ensure that remotely-sensed data from orbiting missions are as accurate as possible. GPM and SMAP are two missions with ongoing GV campaigns and are examples of the challenges—as well as the numerous benefits—of conducting these field investigations.

The Olympic Mountains Experiment (OLYMPEX)

Olympex logo

Few areas in the continental U.S. are more conducive for studying precipitation than the Olympic Peninsula. Sitting on the northwest coast of Washington State and jutting into the Pacific Ocean, the peninsula is not only the wettest place in the contiguous U.S., but also home to the only temperate old growth rain forest in the contiguous U.S. According to research by Daly, et al., based on Parameter-elevation Relationships on Independent Slopes Model (PRISM) precipitation data, windward slopes near the Olympic crest can receive 6,000 to 7,000 mm of precipitation a year—that’s more than 19 feet of precipitation.

The GPM Core Observatory launched on 27 February 2014 and collects precipitation data between roughly 65˚ north and south latitude from onboard instruments and helps calibrate precipitation data from multiple orbiting precipitation satellites. OLYMPEX was the last of several larger GPM GV campaigns.

The idea for a campaign like OLYMPEX was first proposed about 10 years ago by Dr. Robert A. Houze, Jr., Professor of Atmospheric Sciences at the University of Washington. Dr. Houze served as the OLYMPEX Principal Investigator (PI) and was one of three operations directors (along with Dr. Walt Petersen and Dr. Lynn McMurdie, Senior Research Scientist at the University of Washington). The years of planning for this three-month campaign included coordinating not only instrument installation locations, but also obtaining permissions from a variety of state, federal, and Native American agencies to gain access to remote field sites.

As Dr. McMurdie observes, calling the research area “challenging” might be an understatement. “The installation [of many instruments] was within national park boundaries and in a designated wilderness area,” she says. “This means you cannot take motorized vehicles in. Plus, there are very few roads, and the roads that do exist, like on the forest land, are pretty rugged. Of course, you also have to deal with pouring rain and blowing wind, which makes these few roads more like small rivers.”

Olumpex mule team
Image Caption

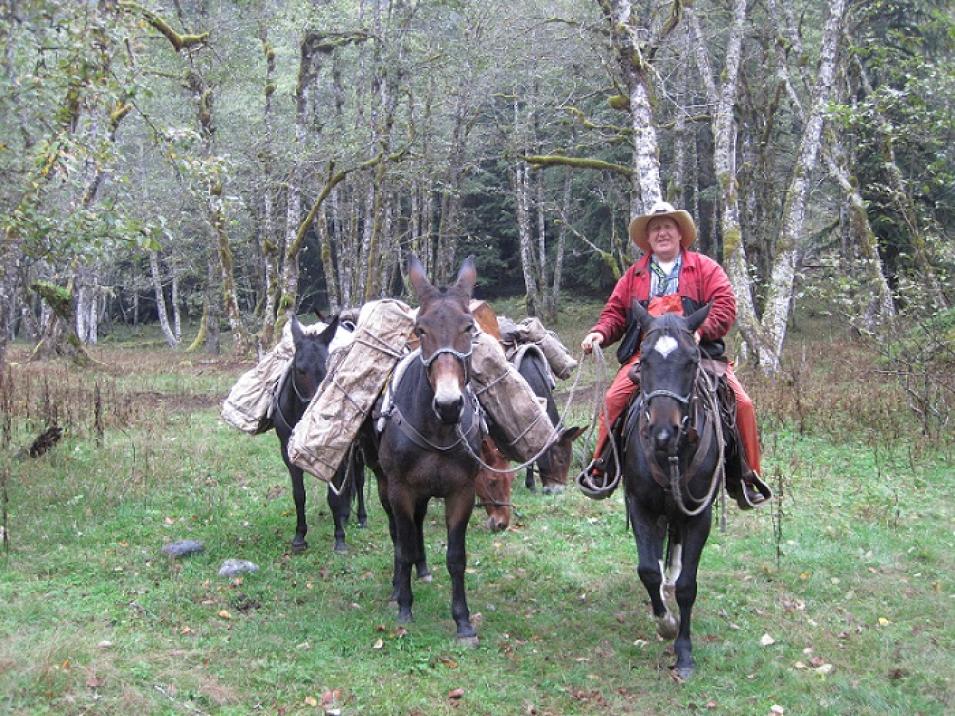
Olympic National Park mule packer Daniel Boone Jones leads a team of mules carrying OLYMPEX ground instruments, batteries, and supplies to field sites. Photo by Bill Baccus, 8 October 2015, from OLYMPEX Flickr photostream, University of Washington, accessed 25 April 2017.

This is where the mules come in. The Wilderness Act of 1964 prohibits motorized vehicles in designated wilderness areas. Since Dr. McMurdie and her team needed to transport instruments, electronic equipment, and solar panels to field sites in a designated wilderness area, mules or horses were one of the only options. Numerous batteries (each weighing 36 kg [about 80 pounds]) also had to be brought in to power the instruments. “The packers and handlers did an amazing job loading the mules,” says Dr. McMurdie. “We had a room full of equipment and they loaded everything into carriers and lined the mules up and off they went. My graduate students went to help install the instruments, but the mule handlers took care of the loading and unloading.”

OLYMPEX, like many field campaigns, involved multiple organizations, agencies, and academic institutions. NASA representatives from several centers and facilities were joined by researchers from organizations including Environment Canada, the National Science Foundation, the National Center for Atmospheric Research (NCAR), the National Weather Service, and the Center for Severe Weather Research. Since the campaign took place on federal and Native American land, the National Park Service, the U.S. Forest Service, and the Quinault Indian Nation also were involved.

For data collection, the OLYMPEX team utilized multiple instruments installed at 16 ground observation sites, imagery from multiple radars, balloon soundings, and three heavily-instrumented aircraft, including NASA’s four-engine DC-8 jet.

Olympex DC-8 flight path
Image Caption

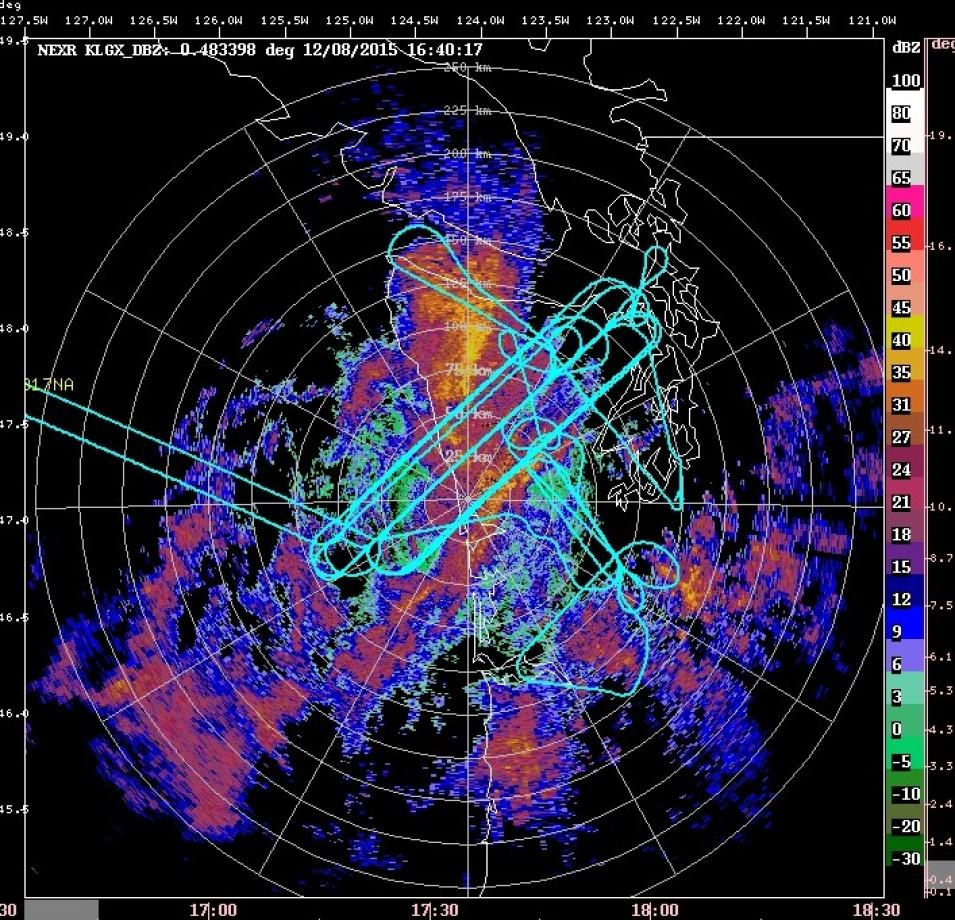
DC-8 flight track from 8 December 2015. Blue/green lines are the flight track. Colored areas indicate precipitation, with orange/red areas indicating heavy precipitation. This 7.2-hour flight sampled an atmospheric river event, which caused heavy flooding in areas over which the jet flew. NASA image.

A typical OLYMPEX day that included a flight started with a 5am forecast briefing by the night forecaster. If the flight was a go, mission flight directors, Dr. McMurdie, and the morning forecaster were in the operations center between 6 and 7am to go over flight plans. Meanwhile, the radar operators were alerted and soundings were sent up. A main briefing took place around 10am, including a forecast, a status report from individual team members, and a review of the plan of the day. At the end of the day, data collected by the aircraft instruments were combined to produce a daily science report. Flight reports for other OLYMPEX aircraft and radar reports from each ground-based radar were also produced daily. If needed, an evening briefing was conducted at 9pm. “12-hour days, 7 days a week for 6-8 weeks was pretty much my life during OLYMPEX,” says Dr. McMurdie.

OLYMPEX data are available through the Global Hydrology Resource Center Distributed Active Archive Center (GHRC DAAC), which is the home for hydrology data from NASA Earth observing missions, including precipitation, lightning, and severe weather. Data also are available through the University of Washington’s OLYMPEX website. Initial campaign data were released early in 2017, and additional data will be released publicly over the year.

Aside from verifying that a lot of rain falls on the Olympic Peninsula, Dr. McMurdie notes that OLYMPEX was a very successful field campaign that is providing the data necessary to validate what the GPM constellation satellites are detecting from space. “We were lucky with the weather—it was dark, it was stormy, it was perfect,” she says.

The Soil Moisture Active Passive Validation Experiment 2016 (SMAPVEX16)

SMAP logo

SMAP launched on 31 January 2015 on a planned three-year mission to globally measure soil moisture in the top 5 cm (2 inches) of soil and assess freeze-thaw states in higher latitudes. These data are used to produce global soil moisture maps, which will help improve our understanding of the water and carbon cycles along with weather and climate.

The calibration/validation of SMAP data is divided into five main components: about 15 Core Validation Sites around the world where SMAP-related experiments take place; Sparse Networks that support the core sites, but have a lower station density and extend across a larger geographic area; non-SMAP satellite products that provide remotely-sensed soil moisture data at scales matching SMAP products; model products that provide soil moisture estimates at scales matching SMAP; and field campaigns that focus on specific items that can resolve isolated problems with SMAP data processing algorithms. “We go from the Core Sites to the Sparse Networks to the satellite and model products, going to a wider and wider scope. Finally, with the field campaigns, we go back to small-scale details and issues and try to resolve them,” says Dr. Andreas Colliander, Research Scientist at NASA’s Jet Propulsion Laboratory (JPL). Dr. Colliander coordinates the calibration/validation activities in the SMAP mission and served as the Science Lead for the Passive Active L- and S-band Sensor (PALS) airborne instrument during the SMAPVEX16 campaign.

During the summer of 2015, SMAP scientists noticed that SMAP’s soil moisture retrieval algorithm was having difficulty retrieving soil moisture over certain regions, generally agricultural areas where vegetation growth is very rapid during the growing season. “The decision was made to conduct [SMAPVEX16] over the sites where we were seeing these challenges, mainly in some of the core sites in Iowa and in Manitoba, Canada,” says Dr. Colliander.

Like OLYMPEX, SMAPVEX16 had both airborne and ground components. The ground component featured two intensive observation periods during the growing season, one at the beginning of the season with bare ground and one at the end of the season with mature biomass and maximum water content. Flights involving several types of aircraft were conducted at the same time as SMAP satellite observations. The field data were from well-defined areas that could be used to calibrate the airborne measurements. These airborne measurements were translated to the larger SMAP sensor observations. Vegetation water content and geometry also were assessed by drying vegetation samples and weighing them along with collecting data on variables including vegetation branch numbers and branch angles.

SMAP surface roughness board
Image Caption

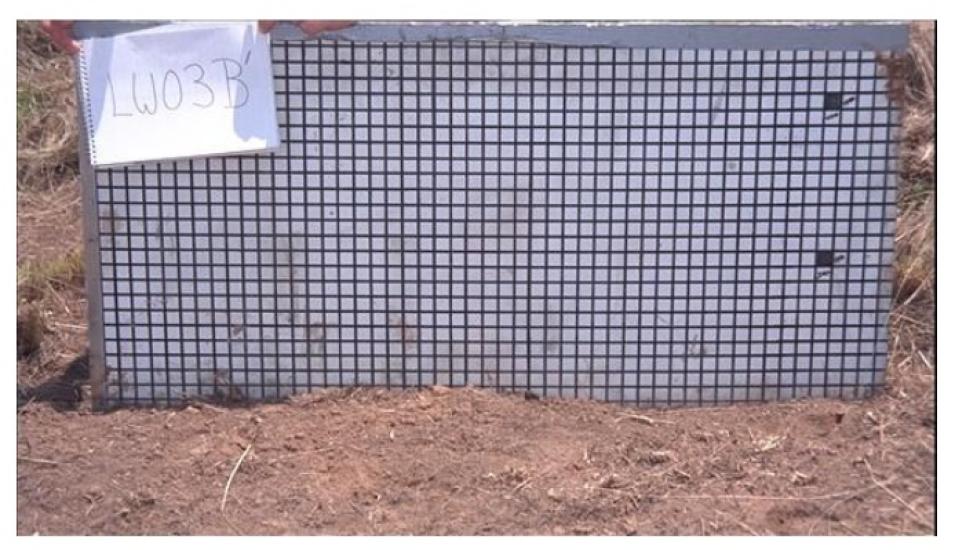
Assessing surface roughness using a grid board. The card in the upper left corner of the board is the site ID. Image from the SMAPVEX16 Iowa Experiment Plan.

An additional measurement was surface roughness, which is known to affect the SMAP soil moisture algorithm (the rougher the ground surface, the greater the effect of this on ground emissions). “We don’t know surface roughness globally, so the global algorithm is based on roughness estimates,” says Dr. Colliander. “These campaigns give us a better idea of the actual surface and vegetation parameters, including roughness, which we feed into the field campaign data. The more field data we have, the better we can adjust the algorithm and improve the global soil moisture retrieval results.”

SMAPVEX16 featured an international research team comprising a number of agencies and organizations. Along with NASA and JPL, which were responsible for the PALS instrument flights, the U.S. Department of Agriculture led the Iowa ground segment. Students from several universities conducted manual sampling. The Manitoba campaign component was funded by the Canadian Space Agency, with local ground operations led by Agriculture and Agrifood Canada. Environment Canada and students from Canadian universities supported and conducted field measurements.

As Dr. Colliander notes, the major concerns in SMAPVEX16 were the weather and ground conditions. In general, the research team wanted a range of soil moisture. “When you have full-grown vegetation, it is better to have wet ground than dry ground because the vegetation is harder to separate from dry soil,” he says. “We had wet soils in the later parts of the experiment, which we were very happy to have. It would have been better to have a little more dry-down to give us some more variability, but this is nature so it’s hard to get optimal conditions.”

Another challenge was timing field measurements with observations of the SMAP satellite. With the satellite observation occurring around 7am local time, the team had to be in the field by 4 or 5am. This was the same schedule for the airborne missions. Thanks to experienced ground and airborne teams, data collection ran smoothly in both Iowa and Manitoba.

SMAPVEX16 data are expected to be available later this year at the National Snow and Ice Data Center DAAC (NSIDC DAAC), which, along with the Alaska Satellite Facility DAAC (ASF DAAC), is responsible for archiving and distributing SMAP data. According to Dr. Colliander, the SMAPVEX16 team was able to collect the data necessary to implement improvements into the SMAP algorithms. “Field experiments like SMAPVEX16 are really critical to improving spaceborne observations,” he says. “They are part of the background work both pre-launch and post-launch that go into enabling satellite missions to make these retrievals for parameters of Earth systems.”

Connecting the dots from the ground up

Ground validation campaigns for GPM, SMAP, and other NASA Earth observing missions help ensure that the remotely-sensed data provided by the DAACs accurately represent real-world processes. Like all NASA data, GV campaign data are fully and openly available, with quality-controlled data publically available generally 6-9 months after the end of a campaign.

As Dr. Petersen, the NASA GPM Deputy Project Scientist for Ground Validation, observes, satellite instruments do not directly measure many components of weather or the Earth system that scientists and researchers actually are trying to observe, such as precipitation; these data are all remotely-sensed and interpreted indirectly using algorithms. Ground validation provides a necessary link. “The ground validation allows you to explicitly connect the dots—the physics between what is being remotely-sensed by instruments in space and what you are interested in measuring in the atmosphere or on the ground,” he says. “It’s important that NASA does these ground validation campaigns and takes advantage of its expertise to make these connections.”

Additional resources and links to campaign data

Daly, C., Halbleib, M., Smith, J.I., Gibson, W.P., Doggett, M. K., Taylor, G.H., Curtis, J. & Pasteris, P.P. (2008). “Physiographically sensitive mapping of climatological temperature and precipitation across the conterminous United States.” International Journal of Climatology, 28: 2031–2064 [doi: 10.1002/joc.1688].

GPM Ground Validation Data Archive: http://gpm-gv.gsfc.nasa.gov/

NASA GHRC DAAC OLYMPEX page: https://ghrc.nsstc.nasa.gov/home/field-campaigns/olympex

NSIDC DAAC SMAP Validation Data: http://nsidc.org/data/smap/validation/val-data.html

SMAP Field Campaigns: https://smap.jpl.nasa.gov/science/validation/fieldcampaigns/

SMAPVEX16 page: https://smap.jpl.nasa.gov/science/validation/fieldcampaigns/SMAPVEX16/

University of Washington OLYMPEX website: http://olympex.atmos.washington.edu
Details

Last Updated

Published

Data Center/Project

Alaska Satellite Facility DAAC (ASF DAAC)
Global Hydrometeorology Resource Center DAAC (GHRC DAAC)
National Snow and Ice Data Center DAAC (NSIDC DAAC)