Cold, Symmetric, and Cryptic

Researchers aim a barrage of sensors at nature's most enduring heiroglyphs.

Snowflakes have intrigued many for centuries, but it has been an especially befuddling ride for remote sensing scientists. Aiming a microwave radiometer at a rainstorm gives them streams of beautiful data. Pointing it at a snowstorm sends the instrument into conniptions. “Scientists have the technology to study rain from space, but we’re forty years behind for snow,” said Gail Skofronick-Jackson, who studies remote sensing of snowfall. “Raindrops are spherical when small, or shaped like burger buns when large.” This simplicity allows satellites to recognize raindrops from 200 miles away. “Snow is trickier to detect because, as you know, it has so many shapes,” she said.

Skofronick-Jackson and about a hundred other scientists in NASA's Global Precipitation Mission Cold-season Precipitation Experiment (GCPEx) are using instruments that can, among other things, tell the difference between raindrops and snowflakes. If they succeed, the Global Precipitation Measurement (GPM) satellite mission will use GCPEx data to measure snowfall worldwide, bringing crucial data to meteorologists, freshwater resource managers, and climate researchers. The big hurdle, however, is teaching it how to see snow.

Photograph of a blizzard in Abbotsford, British Columbia
Image Caption

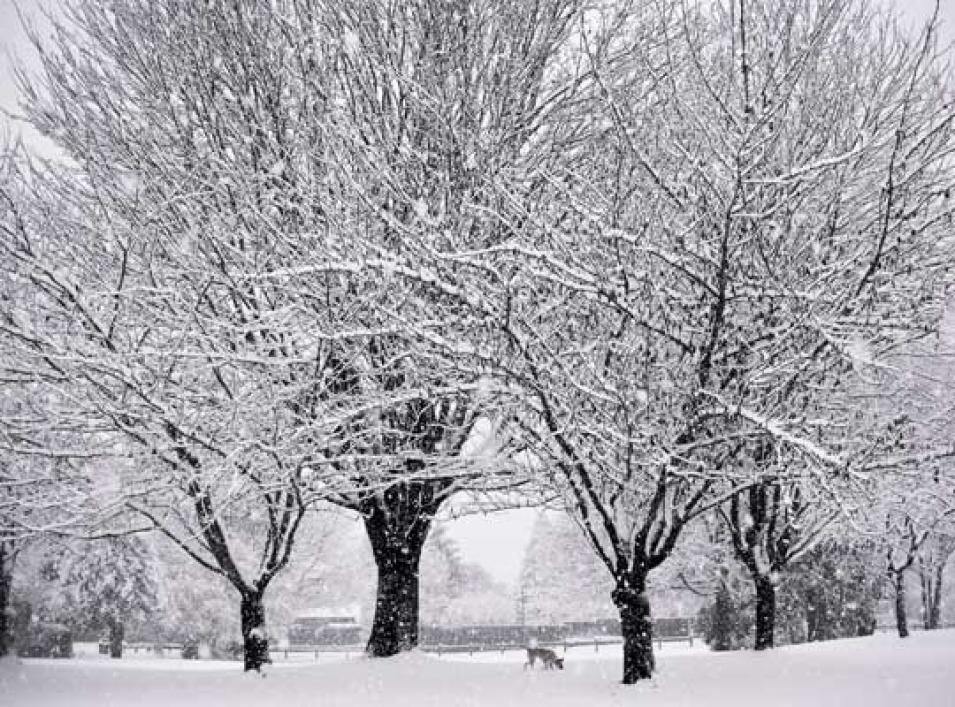
A dog explores a park during a blizzard in the town of Abbotsford, British Columbia, Canada. (Courtesy J. Moore)

Decoding snowflakes

Scientists and snow enthusiasts have gotten closer to understanding snowflakes with every advance in technology. In 1635, mathematician René Descartes sketched snowflakes he had examined with the naked eye, noting shapes like capped columns and the rare twelve-sided snowflake. Thirty years later, philosopher Robert Hooke drew snowflakes he had observed under a microscope. American farmer Wilson Bentley rigged a microscope to a large format camera in the 1880s, amassing 5,000 images of snowflakes as a hobby until his death in 1931, and not finding any two alike.

Magnified image of a capped column snowflake
Image Caption

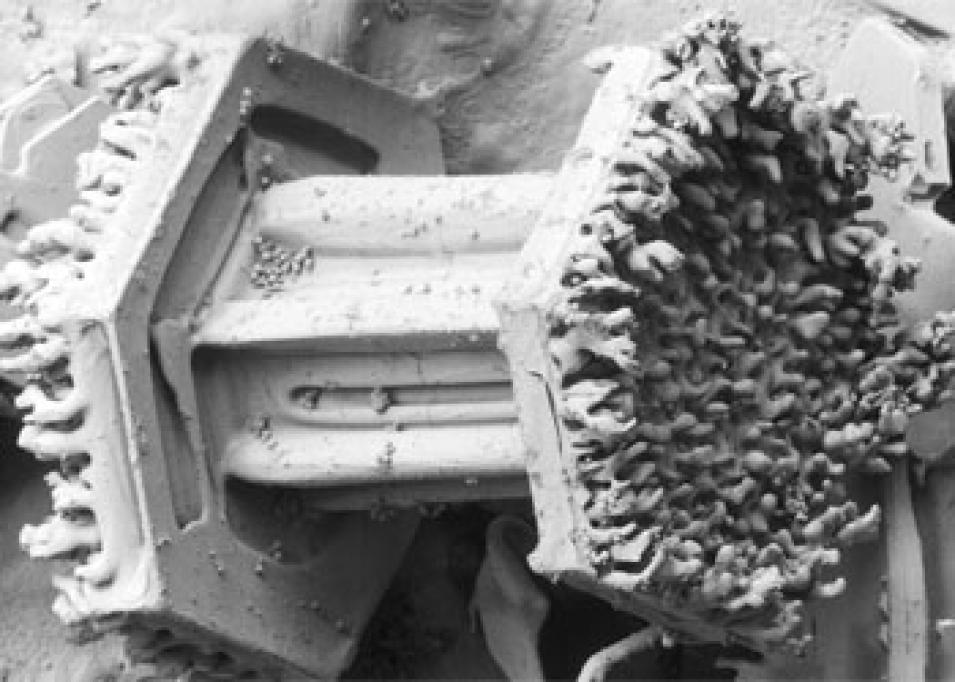
Rime frost covers both ends of a capped column snowflake, captured at 300 micrometers under an electron microscope. (Courtesy P. Erbe, U.S. Department of Agriculture, Agricultural Research Service, Electron Microscopy Unit)

It was Bentley who realized why identical snowflakes were hard to find. A snowflake’s size and shape, Bentley thought, must be influenced by varying temperatures it travels through, from the snow cloud to the ground. Japanese physicist Ukichiro Nakaya proved this in the 1940s after photographing thousands of artificially grown snowflakes in his refrigerated laboratory in Sapporo.

Nakaya discovered that specific conditions produced certain kinds of snowflakes. At -2 degrees Celsius, a bit below freezing, he grew thin, plate-like snowflakes. At -5 degrees Celsius he got thin, needle-like snowflakes. Cranking his apparatus to the coldest setting at -25 degrees Celsius produced thicker plate-like and columnar snowflakes. Intricate snow crystals with radiating, fern-like branches blossomed with humidity, and simple hexagons formed under dry conditions. Nakaya wrote that snowflakes were like “letters from the sky,” bearing stories about the meteorological conditions they were born in.

The whole elephant

Scientists had to wait a few more decades before they could use snowflake morphology to predict snowstorms. Today’s meteorologists use weather models that rely on snowflake shapes catalogued in the 1970s. However, snowstorm forecasts remain iffy because scientists still have much to learn about snowfall, including how fast or slow different snowflakes whip about inside storm clouds or the best way to define the speed at which they fall from the sky. The sheer variety of snowflake shapes and how much water each shape holds also continue to throw off weather radars and satellite radiometers.

Not so with rain. Scientists sent the first weather satellites into space in the 1960s and by the 1990s had developed sophisticated sensors that measured rain and mapped out the churning innards of hurricanes. NASA's Tropical Rainfall Measuring Mission (TRMM) satellite helped atmospheric scientists improve weather forecasts and fine-tune flood and drought prediction. But because TRMM is designed for rain, it only orbits the tropics where warm equatorial waters spawn the biggest, most destructive storms.

Scientists need a satellite that would do for snowstorms, what TRMM does for rainstorms—one that scans Earth’s snow-covered mountain regions and the frigid poles. “To see snow, a satellite must be specially designed for snow,” Skofronick-Jackson said. To do that, scientists have to feed the satellite more data on falling snow.

So GCPEx scientists hunkered down in the Canadian countryside and aimed radars and other sensors at passing snowstorms. They launched instrument-loaded aircraft into snow clouds while a satellite simulator watched from Earth’s lower stratosphere. Reminiscent of the tale of the blind men and the elephant, where blind men feel different parts of the animal to describe the whole elephant, GCPEx scientists set out to observe as many parts of a snowstorm as they could. Walter Petersen, GCPEx ground validation chief, said, “We essentially tried to follow snowflakes from the clouds to the ground.”

Rime frost covers both ends of a capped column snowflake, captured at 300 micrometers under an electron microscope. (Courtesy P. Erbe, U.S. Department of Agriculture, Agricultural Research Service, Electron Microscopy Unit)
Image Caption

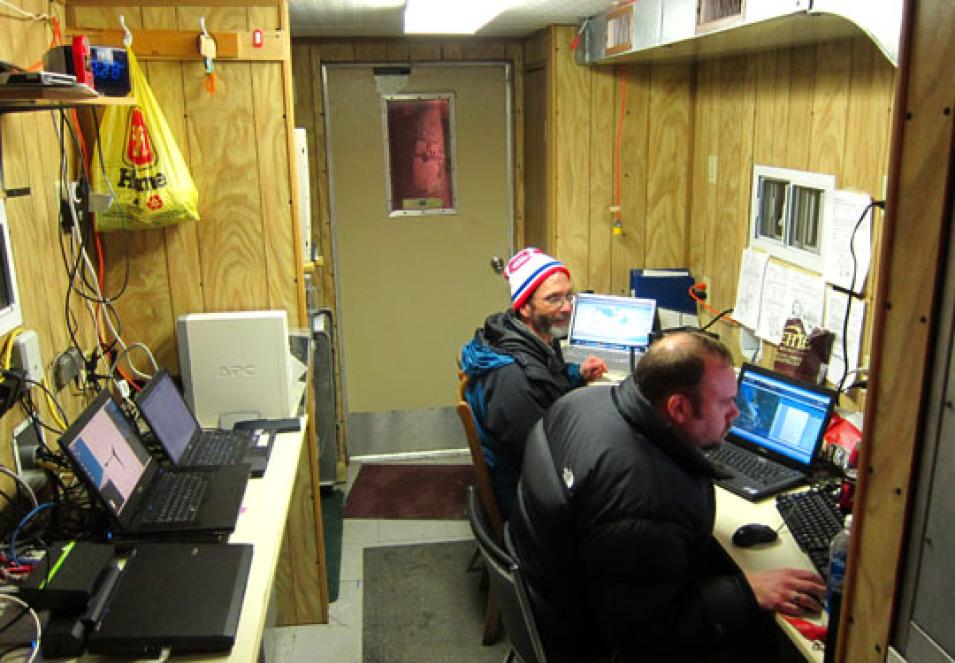
GCPEx scientists Norm Wood (left) and Tristan L’ Ecuyer monitor flights and weather in the mission operations trailer—which can be very cold at times. (Courtesy NASA/C. Kidd)

A golden storm

In Egbert, Ontario, researchers tracked storms from a cramped and barely heated trailer beginning January 17, 2012. By the tail end of the campaign, they had only sampled mild snowstorms and lake-effect storms from cold winds blowing over warmer Lake Huron. GCPEx researcher Patrick Gatlin said, “We were still waiting for that one, classic winter storm.” They wanted a synoptic storm, at least 600 miles across and churning with complexities. On February 24, they got their wish.

Magnified data image of falling snowflakes
Image Caption

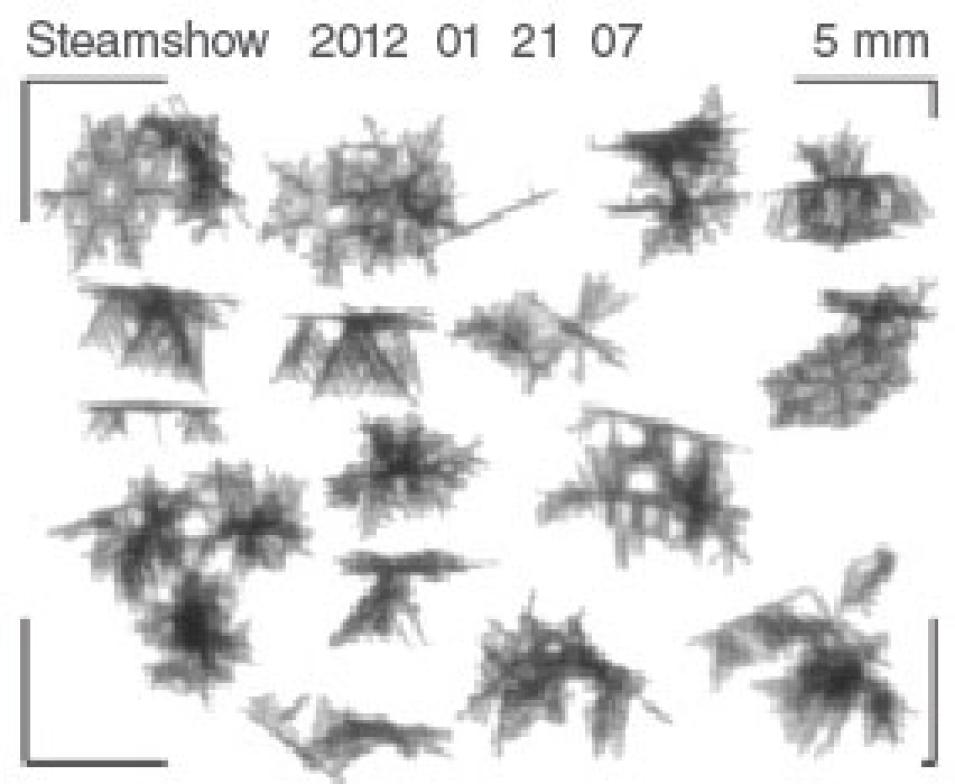
This image of falling snowflakes was taken by the Snow Video Imager (SVI) at Steamshow Fairgrounds, one of the auxiliary ground sites for the GCPEx campaign. The SVI is set up about a foot off the ground and the snowflakes fall from top to bottom through the frame. They can be seen here in different three-dimensional orientations at 5x magnification. (Courtesy NASA/L. Bliven)

As the storm approached Egbert, three aircraft were already en route. NASA's DC-8 airplane flew high above the storm carrying the Airborne Precipitation Radar-2 and the Conical Scanning Millimeter-wave Imaging Radiometer (CoSMIR), instruments similar to those that would fly in space. “The DC-8 is our proxy satellite,” Petersen said. “It collects data that will help us connect what we see from space to what is going on in the storm and on the ground.”

In the snowing clouds, the University of North Dakota’s Citation and the Canadian National Research Council’s Convair flew spirals in and under the storm and dog bone patterns along the snow band. These aircraft flew meteorological sensors and probes that measured snowflake size and water content, as well as temperature and cloud water. On land, an array of twenty instruments measured the physical aspects of the snow. How much did it weigh? How fast did it fall? What kinds of snowflake shapes were falling and how much water did they hold?

“We are building this column of understanding of snowfall and snowfall characteristics from the top of the cloud all the way to the ground,” Gatlin said. The storm was just what they needed to wrap up the campaign. “It was the golden storm,” Gatlin said. “Everything came together at once; all the aircraft flew and all the ground sensors were working and collected a lot of data.”

Like a shaken snow globe

The researchers are on track to use the data to prep the Global Precipitation Mission (GPM) Core Observatory satellite that launches in 2014. The satellite will be the first to recognize and measure snow from space, and do so before snow lands on the ground. “That’s what’s so different about this satellite. We specifically designed it to make global measurements of snow before it hits Earth’s surface,” Skofronick-Jackson said. “Satellites have difficulties measuring snow in mountainous regions. So it’s great to be able to measure snow before you have to deal with these surface features.”

Scientists currently measure snow using snow pillows, platforms on the ground that weigh snow pack. Unfortunately, the snow pillows are sparse, and it is hard to tease out global trends from the data. There are satellites that measure snow cover worldwide but these run into problems when flying over forests. “If the snow lands on the trees or falls through the trees, that affects the satellite’s ability to measure snow,” Skofronick-Jackson said. “The same goes for snowpack that gets a heavy crust of ice on top of it from repeated melting and refreezing.”

The GPM Core Observatory, which will also measure rain, will not identify every single snowflake shape that it sees, but “in a bulk sense, will know whether they are all needles, mostly hexagonal plates, or all dendrites which are the pretty ones you normally see,” Skofronick-Jackson said. It will still take scientists several years to catch up to where rain measurement is right now. “But we are starting that process with this satellite,” she said. “After the field campaign, we re-recognized that snow is a complex process, and being able to understand it and estimate falling snow from spaceborne instruments is going to be a process for several generations of scientists to come.”

References

Molthan, A. L., and W. A. Petersen. 2011. Incorporating ice crystal scattering databases in the simulation of millimeter-wavelength radar reflectivity. Journal of Atmospheric and Oceanic Technology 28, 337–351, doi:10.1175/2010JTECHA1511.1.

NASA Global Hydrometeorology Resource Center Distributed Active Archive Center (GHRC DAAC). GPM-GV GCPEx Products. Huntsville, Alabama USA.

Skofronick-Jackson G. M., M.-J. Kim, J. A. Weinman, and D.-E. Chang. 2004. A physical model to determine snowfall over land by microwave radiometry. IEEE Transactions on Geoscience and Remote Sensing 42: 1,047–1,058, doi:10.1109/TGRS.2004.825585.

Skofronick-Jackson, G., and B. T. Johnson. 2011. Surface and atmospheric contributions to passive microwave brightness temperatures for falling snow events. Journal of Geophysical Research 116, D02213, doi:10.1029/2010JD014438.

Thurai, M., V. N. Bringi, L. D. Carey, P. Gatlin, E. Schultz, W. A. Petersen. 2012. Estimating the accuracy of polarimetric radar–based retrievals of drop-size distribution parameters and rain rate: an application of error variance separation using radar-derived spatial correlations. Journal of Hydrometeorology 13: 1,066–1,079, doi:10.1175/JHM-D-11-070.1.

For more information

NASA Global Hydrometeorology Resource Center Distributed Active Archive Center (GHRC DAAC)

NASA Global Precipitation Measurement (GPM) Cold-season Precipitation Experiment

About the data used
Sensor Various aircraft microphysical probes, thermodynamic sensors, radiometers, profilers, radars, disdrometers, and precipitation gauges
Data sets Airborne Precipitation Radar version 2 (APR-2) Conical Scanning Millimeter-wave Imaging Radiometer (CoSMIR) Aircraft mounted particle probes and thermodynamic sensors (UND Citation and CNRC Convair 580) Dual frequency dual polarimetric Doppler radar (D3R) Environment Canada C-band dual-polarimetric Doppler radar at King City, Ontario Advanced Microwave Radiometer for Rain Identification (ADMIRARI) Centre for Atmospheric Research Experiments (CARE) vertical profiling radiometer and X-band radar Disdrometers, precipitation gauges and meteorological conditions at each ground site
DAAC NASA Global Hydrometeorology Resource Center Distributed Active Archive Center (GHRC DAAC)

The photograph in the title graphic shows a close-up view of a snowflake. (Courtesy theharv58/Flickr)
Details

Last Updated

Published

Data Center/Project

Global Hydrometeorology Resource Center DAAC (GHRC DAAC)