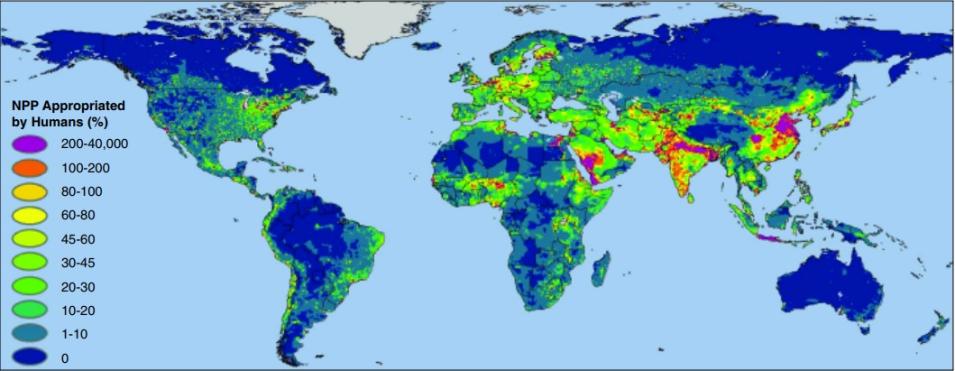
Next, Imhoff requested the Gridded Population of the World (GPW) data set, which provides population numbers and density on a regular latitude-longitude grid, from NASA's Socioeconomic Data and Applications Center (SEDAC). “We overlaid the consumption data on the population map and ended up with a gridded surface map showing the amount of net primary production required to support the consumption habits of different human populations all over the world.” This map gave Imhoff the information he needed to compare production supply with human demand.
Keeping up with demand
When he compared the global supply of net primary production to the human appetite, Imhoff confirmed some ideas that did not surprise him. “Some things were a no-brainer,” he said. “For example, urban populations with a high density consume way more primary production than local ecosystems can produce.” One sharp example of this was New York City, which consumed 300 times more primary production than it created. “That says a lot about the dependence of urban areas on our transportation networks and agricultural infrastructure,” he said. The ratio of consumption to regional net primary productivity might prove to be a useful indicator of potential trouble spots should natural disasters, economic insecurity, or other problems undermine networks or infrastructure.
Having enough food may seem like a concern only for developing countries, but industrialized countries also have concerns about food security, which is defined simply as always having enough food for an active, healthy life. Developed countries may have dense urban populations, import more food, and be accustomed to high levels of consumption—all of which make these countries susceptible to transitory food supply disruptions. In addition, developed countries may have poor populations that are vulnerable to rising food prices in spite of typical governmental support services. Imhoff said, “Worldwide, we have some very vulnerable populations that could never survive just on the productivity of the land on which they live—with some important implications for national and regional food security.”
Closely tied to the question of having enough food for survival is the idea of having enough fuel, clothing, and building materials for survival. The availability of everything from firewood to winter coats begins with plants. Consumption of material goods is an important factor in economic stability and security, as well as in maintaining or improving lifestyle levels. The more a population consumes, the more effort it takes to maintain that standard of consumption. Imhoff found that there were two big factors that lead to high consumption levels. The first is high per-capita consumption rates, as seen in much of the developed world; the second is large populations. Even a low per-capita consumption rate can result in a huge overall level of total consumption if multiplied over a large number of people.
To Imhoff, a more surprising finding was the importance of technology in helping balance the equation between supply and consumption. “We found that using improved technology—especially in harvesting and storage techniques—can actually halve the amount of waste in agricultural production,” he said. “Take logging. Without the benefits of improved harvesting technology, you might literally lose a tree for every one that you use.”
The interplay between population, consumption rates, affluence, and technology leads to some thought-provoking realizations. “For example, Asia’s per-capita consumption is on the rise,” he said. “If consumption begins to match Western levels, there will be a significant increase in demand for food and fiber products. If technology improvements do not come with that growth, then you’ll see populations that are outstripping their regional food production capacity. They’ll be more dependent on resources elsewhere, and will have to compete for them.” Although citizens in industrialized countries may not find the rising population in developing nations of immediate concern, poverty has been connected to terrorism, war, underemployment, border pressures, disease, and political unrest.
“It’s a question of how much we are willing to pay to keep getting the level of production that we want, and to transport it from one place to another,” Imhoff said.
Can we afford it?
Stanley Wood, of the International Food Policy Research Institute (IFPRI), agreed with Imhoff ’s emphasis on the question of costs. “The bottom line is food availability and food affordability. How stretched will our incomes be to meet our food requirements?” Wood works with a team from the IFPRI that collaborated with Imhoff on the net primary production research and which has joined with him on a new proposal that builds on the initial work.
Imhoff and the IFPRI team hope to improve their understanding of the flow of net primary production between countries. Wood said, “For example, let’s say that energy security becomes an increasing concern and the U.S. turns to biofuels. The global price of maize could rise steeply because of competition between maize for food and feed, and maize for biofuels. This would create a double-edged sword for poor countries: the increased prices would generate more income for developing country farmers, but would be bad news for poor consumers.”
Widening the global picture is also something that Imhoff hopes to do. “We have begun projecting what would happen to plant production with climate change, and you don’t have to look very far to see that the geopolitics of food production could change significantly, with some countries winning and others losing. Even without climate change, we are already rubbing up against some limits in our planet’s ability to supply us,” he said.
Both Wood and Imhoff hope their data set on human use of net primary productivity, which is now available through SEDAC, will be useful to policy and decision makers, both in governmental and nongovernmental agencies. “We hope to have more one-on-one conversations with users in the future,” Imhoff said. “With the unprecedented population levels that we have, now, surprises can develop very quickly. We need to be ready.”
However, even with a growing global population, increasing consumption levels, and other global changes bearing down on us, Imhoff emphasized the positive. “We have the technology to get out ahead of this. The data isn’t just showing us the bad news; it is also giving us the power to study the changes ahead and understand them,” he said. “We are far from being helpless. Our ability to assess our environment and our situation should give us a sense of empowerment.”
References
Imhoff, M. L., and L. Bounoua. 2006. Exploring global patterns of net primary production carbon supply and demand using satellite observations and statistical data. Journal of Geophysical Research 111, D22S12, doi: 10.1029/2006JD007377
Imhoff, M. L., L. Bounoua, T. Ricketts, C. Loucks, R. Harriss, and W. T. Lawrence. 2004. Global patterns in human consumption of net primary production. Nature 429: 870–873.
Millennium Ecosystem Assessment. 2005. Ecosystems and human well-being. Volume 1: Current state and trends. London: Island Press.
United Nations. 2005. Development: Rising population threatens global security.
World Watch Institute: Global security http://www.worldwatch.org/taxonomy/term/54/
For more information
NASA Oak Ridge National Laboratory Distributed Active Archive Center (ORNL DAAC)
NASA Socioeconomic Data and Applications Center (SEDAC)
Human Appropriation of Net Primary Productivity
International Food Policy Research Institute
| About the data |
|---|
| Satellite | | Polar-Orbiting Operational Environmental Satellite (POES) |
| Sensor | | Advanced Very High Resolution Radiometer (AVHRR) |
| Data sets | Gridded Population of the World (GPW) | International Satellite Land-Surface Climatology Project (ISLSCP) II Global Inventory Modelling and Mapping Studies (GIMMS) Monthly Normalized Difference Vegetation Index (NDVI) 1981–2002 |
| Resolution | 2.5 minutes latitude/longitude; 1990–2015, every 5 years | 1 kilometer, 16 days |
| Parameters | Human population density | NDVI |
| DAACs | NASA Socioeconomic Data and Applications Center (SEDAC) | NASA Oak Ridge National Laboratory (Distributed Active Archive Center (ORNL DAAC) |

