Earth Science Data Roundup: January 2025

A summary of datasets, products, and resources released by NASA’s Distributed Active Archive Centers (DAACs) in December 2024.

Global Hydrometeorology Resource Center Distributed Active Archive Center (GHRC DAAC)

ER-2 X-Band Doppler Radar (EXRAD) IMPACTS Dataset Now Available

The ER-2 X-band Doppler Radar (EXRAD) IMPACTS dataset is now available from NASA's GHRC DAAC. The dataset, which consists of data gathered during the Investigation of Microphysics and Precipitation for Atlantic Coast-Threatening Snowstorms (IMPACTS) field campaign, provides radar reflectivity and Doppler velocity estimates collected by the EXRAD instrument aboard the NASA ER-2 high-altitude research aircraft. The data are available from January 25, 2020, through March 2, 2023, and are in HDF5 format.

IMPACTS was a three-year sequence of winter season deployments conducted to study snowstorms over the U.S. Atlantic Coast (2020-2023). The project aimed to provide observations critical to understanding the mechanisms of snowband formation, organization, and evolution; examine how the microphysical characteristics and likely growth mechanisms of snow particles vary across snowbands; and improve snowfall remote sensing interpretation and modeling to advance prediction capabilities significantly.
Access EXRAD IMPACTS data and more information

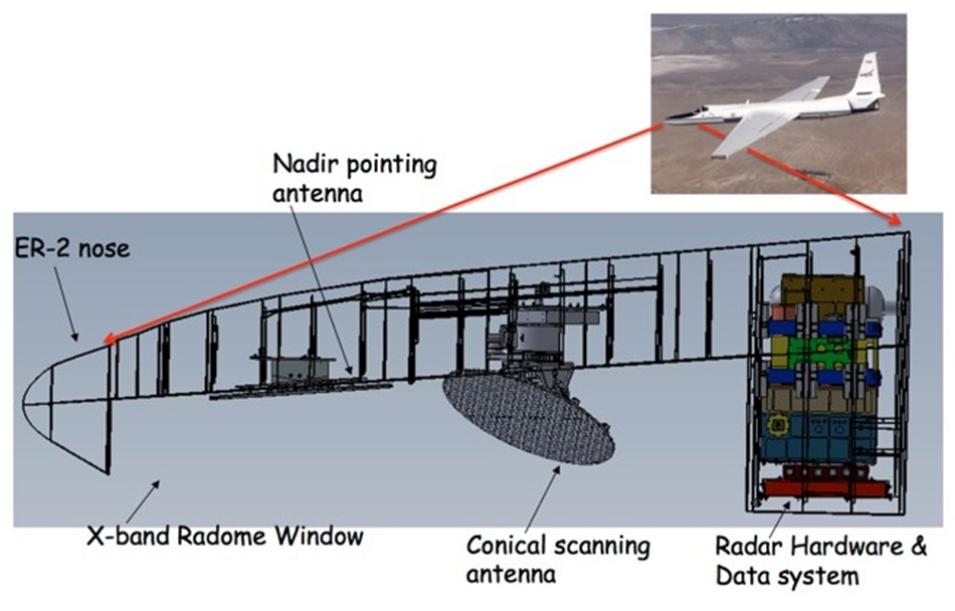
This graphic shows the location and components of the EXRAD instrument on the NASA ER-2 research aircraft.
Image Caption

This graphic shows the location of the EXRAD instrument on the ER-2 aircraft and provides an overview of the EXRAD's components aboard the plane. Image source: Goddard Space Flight Center EXRAD webpage

Goddard Earth Sciences Data and Information Services Center (GES DISC)

GlobFireCarbon Dataset Released

NASA’s GES DISC has released the Global Fire carbon emissions from Carbon Monitoring System (CMS)-Flux inversions assimilating atmospheric carbon monoxide observations (GlobFireCarbon) dataset, which provides global estimates of the carbon monoxide and carbon dioxide cycle constrained by satellite observations through the CMS-Flux) carbon cycle data assimilation system. The data in all the files are organized on an equal angle 2.5ºx2º grid in longitude and latitude with a 1-day temporal resolution. The files are available in netCDF-4 format.

The Carbon Monitoring System (CMS) uses the full range of NASA satellite observations and modeling and analysis capabilities to establish the accuracy, quantitative uncertainties, and utility of products for supporting national and international policy, regulatory, and management activities. It maintains a global emphasis while providing finer scale regional information, utilizing space-based and surface-based data, to initiate the generation and distribution of products for user evaluation and to inform near-term policy development and planning.

Access GlobFireCarbon data and more information

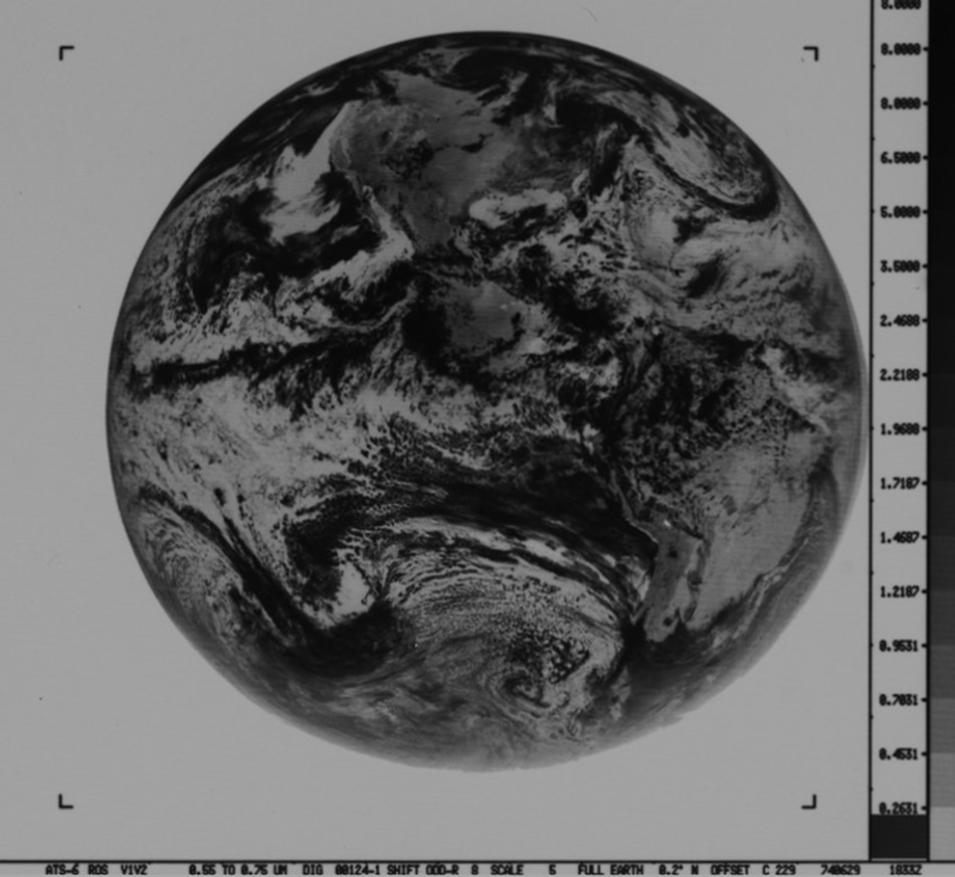
Historical GVHRR/ATS-6 Film Images Now Available Online

NASA's GES DISC has released two historical data collections of imagery from the Geosynchronous Very High Resolution Radiometer (GVHRR) instrument on the sixth Applications Technology Satellite (ATS-6). The collections consist of infrared and visible images originally on film that have been scanned to digital TIFF files. The two released image collections are:

  • GVHRR/ATS-6 Black and White Infrared Images on Film V001 (GVHRRATS6IMIR)
  • GVHRR/ATS-6 Black and White Visible Images on Film V001 (GVHRRATS6IMVIS) 

The ATS-6 satellite was in a geosynchronous orbit at 95° West and the GVHRR instrument, which viewed the Western Hemisphere, acquired images from June 7, 1974, to August 15, 1974. 

Access GVHRR/ATS-6 images and more information

A Geosynchronous Very High Resolution Radiometer (GVHRR) Black and White visible image of the Western Hemisphere.
Image Caption

A black and White visible image of the Western Hemisphere from the Geosynchronous Very High Resolution Radiometer (GVHRR) aboard the ATS-6 satellite. The grayscale bar at right indicates brightness temperatures. Credit: GES DISC

Land Processes Distributed Active Archive Center (LP DAAC)

VIIRS Version 2 Land Surface Phenology Data Products Released

NASA’s LP DAAC has released the Visible Infrared Imaging Radiometer Suite (VIIRS) Version 2 Land Surface Phenology product suite, which includes two data products from the joint NASA-NOAA Suomi National Polar-orbiting Partnership (Suomi NPP) satellite. 

  • The VIIRS/Suomi NPP Land Surface Phenology Yearly Level 3 Global 500-meter SIN Grid V002 (VNP22Q2) data product provides global land surface phenology (GLSP) metrics at yearly intervals. Vegetation phenology metrics are offered at 500-meter spatial resolution and are identified for up to two detected growing cycles per year.
  • The VIIRS/Suomi NPP Land Surface Phenology Yearly Level 3 Global 0.05Deg CMG V002 (VNP22C2) data product provides global land surface phenology (GLSP) metrics at yearly intervals. Vegetation phenology metrics at 0.05 degree (~5,600 meters) spatial resolution are identified for up to two detected growing cycles per year.

Both products are derived from time series of the two-band Enhanced Vegetation Index-2 (EVI2) calculated from VIIRS Nadir Bidirectional Reflectance Distribution Function (BRDF)-Adjusted Reflectance and cover the period from 2013 to the present. The data are available in HDF5 format.

Access VIIRS Version 2 Land Surface Phenology data and more information

NASA MEaSUREs Geostationary Earth Orbit Land Surface Temperature (GEOLST) Version 2 Data for 2017 through 2023 Now Available

NASA's Making Earth System Data Records for Use in Research Environments (MEaSUREs) Geostationary Earth Orbit Land Surface Temperature Hourly North and South America (GEOLST4KHR) version 2 swath data for years 2017 through 2023 is now available from NASA's LP DAAC. These new data use imagery from Geostationary Operational Environmental Satellites (GOES) 15, 16, and 17. Included in this product are layers for cloud mask, latitude, longitude, land surface temperature, and land surface temperature error. With the addition of these data, GEOLST4KHR data record now extends from the year 2000 through 2023.

Access GEOLST4KHR version 2 swath data and more information

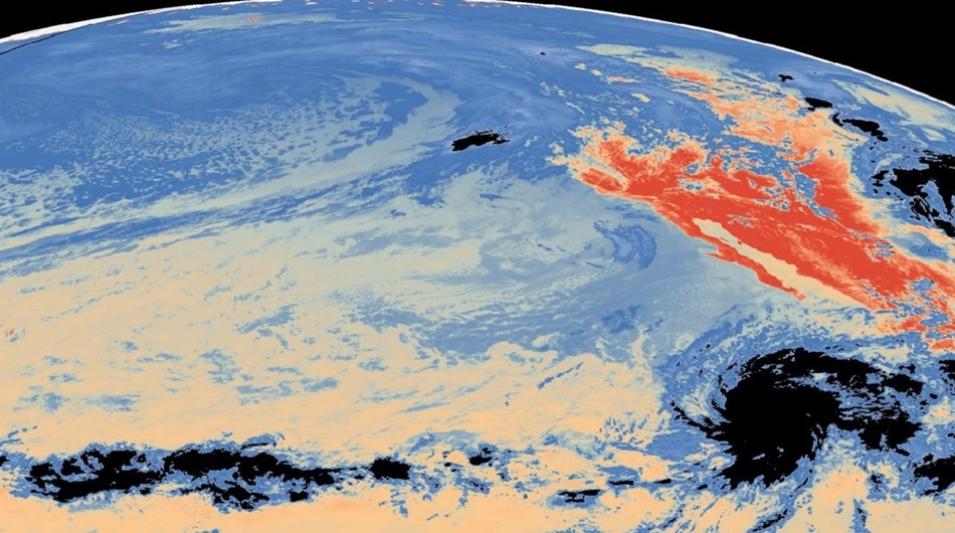
A visualization of Land Surface Temperature (LST) over North America and the Pacific Ocean.
Image Caption

A visualization of Land Surface Temperature (LST) data over North America and the Pacific Ocean. The data are from the Geostationary Earth Orbit Land Surface Temperature Hourly North and South America (GEOLST4KHR) product on May 28, 2002. The product uses data from Geostationary Operational Environmental Satellites (GOES) 15, 16, and 17. Credit: LP DAAC

AppEEARS Version 3.68 Released

NASA's LP DAAC has released Version 3.68 of the Application for Extracting and Exploring Analysis Ready Samples (AppEEARS). This release resolves the remaining issue with the netCDF4 outputs that was partially addressed in Version 3.65.  Users should note that this bug may have impacted previous requests for netCDF4 outputs for ECOSTRESS Tiled, HLS, and Landsat ARD data products. Therefore, users are advised to evaluate their area samples that include these collections or resubmit them to ensure the accurate data are obtained.

Learn more about AppEEARS Version 3.68

Atmospheric Ancillary Input Changes to ASTER Level 2 Product Generation Executables

NASA's LP DAAC has announced that, as of December 18, 2024, ASTER Product Generation Executables (PGE) Version 3.4-3_9 has implemented the Modern-Era Retrospective analysis for Research and Applications Version 2 (MERRA-2) as a new ancillary input in the atmospheric correction of ASTER Level 2 data products. 

MERRA-2 is a global atmospheric reanalysis that combines remote sensing observations and interactions with the climate system. It will be one of the primary ozone and water vapor, pressure, and temperature inputs for all ASTER Level 2 PGEs. MERRA-2 will provide a finer geographic resolution grid since it is a 3D, 3-hour data collection with a 50-kilometer (latitudinal direction) spatial resolution.

Learn more about how this change will impact users and ASTER Level 2 on-demand products.

National Snow and Ice Data Center Distributed Active Archive Center (NSIDC DAAC)

Images of Antarctic Ice Shelves, Version 2 Dataset Updated

NASA’s NSIDC DAAC has updated the Images of Antarctic Ice Shelves, Version 2 dataset. The Images of Antarctic Ice Shelves dataset was created as part of an effort to monitor major ice streams and outlet glaciers along the Antarctic coast, with a focus on the ice shelves considered the most susceptible to rapid change due to climatic warming and those that occasionally calve major icebergs. This monitoring effort began using 1-kilometer images from the Advanced Very-High-Resolution Radiometer (AVHRR) instrument aboard several NOAA polar-orbiting satellites, and later included images from the Moderate Resolution Imaging Spectroradiometer (MODIS) instruments aboard NASA’s Terra and Aqua satellites. In this update, the temporal coverage has been extended to include files from June 1, 2024, through August 31, 2024.

Learn more about the updated Images of Antarctic Ice Shelves, Version 2 dataset

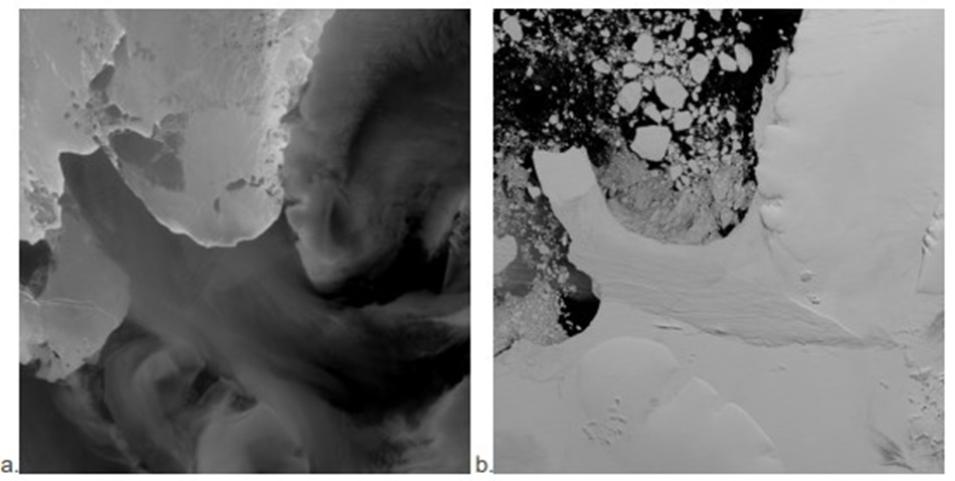
A pair of MODIS images shows the Filchner ice shelf on April 1, 2000 (a) and on January 1, 2001 (b).
Image Caption

These MODIS images show the Filchner ice shelf on April 1, 2000, in the thermal infrared channel (a) and on January 1, 2001, in the visible channel (b). Credit: NSIDC DAAC

SnowEx23 Mar23 Snow Pit Measurements, Version 1 Dataset Now Available

The SnowEx23 Mar23 Snow Pit Measurements, Version 1 dataset is now available from NASA's NSIDC DAAC. This dataset presents snow pit measurements collected during the NASA SnowEx March 2023 Intensive Observation Period in Alaska to use for calibration and validation with coincident airborne SWE Synthetic Aperture Radar and Radiometer (SWESARR) and lidar measurements as part of the strategy focused on snow water equivalence and snow depth. Three study areas represent boreal forest snow near Fairbanks and two study areas represent Arctic tundra snow. The temporal range spans from March 7 to March 16, 2023.

Access the SnowEx23 Mar23 Snow Pit Measurements, Version 1 dataset and more information

Oak Ridge National Laboratory Distributed Active Archive Center (ORNL DAAC)

MODIS/ASTER Airborne Simulator (MASTER) Western Diversity Time Series Campaign (WDTS), Spring 2024 Dataset Now Available 

NASA's ORNL DAAC released the MODIS/ASTER Airborne Simulator (MASTER) Western Diversity Time Series Campaign (WDTS), Spring 2024 dataset, which includes Level 1B data products from the MASTER instrument. The spectral data were collected as part of WDTS (formerly HyspIRI) airborne campaign during four flights aboard a NASA ER-2 aircraft over California and Nevada from June 4 to June 28, 2024. Data products include Level 1B georeferenced multispectral imagery of calibrated radiance in 50 bands (covering wavelengths of 0.460 to 12.879 micrometers) at approximately 50-meter spatial resolution. The data are in HDF4 format and include the path, spectral band information, instrument configuration, ancillary notes, and summary information for each flight, as well as browse images derived from each Level 1B data file.

The WDTS campaign will observe California's ecosystems and provide critical information on natural disasters such as volcanoes, wildfires, and drought. MASTER products can identify vegetation type and health to provide a benchmark for the state of the ecosystems against which future changes can be assessed. 

Access MASTER WDTS data and more information

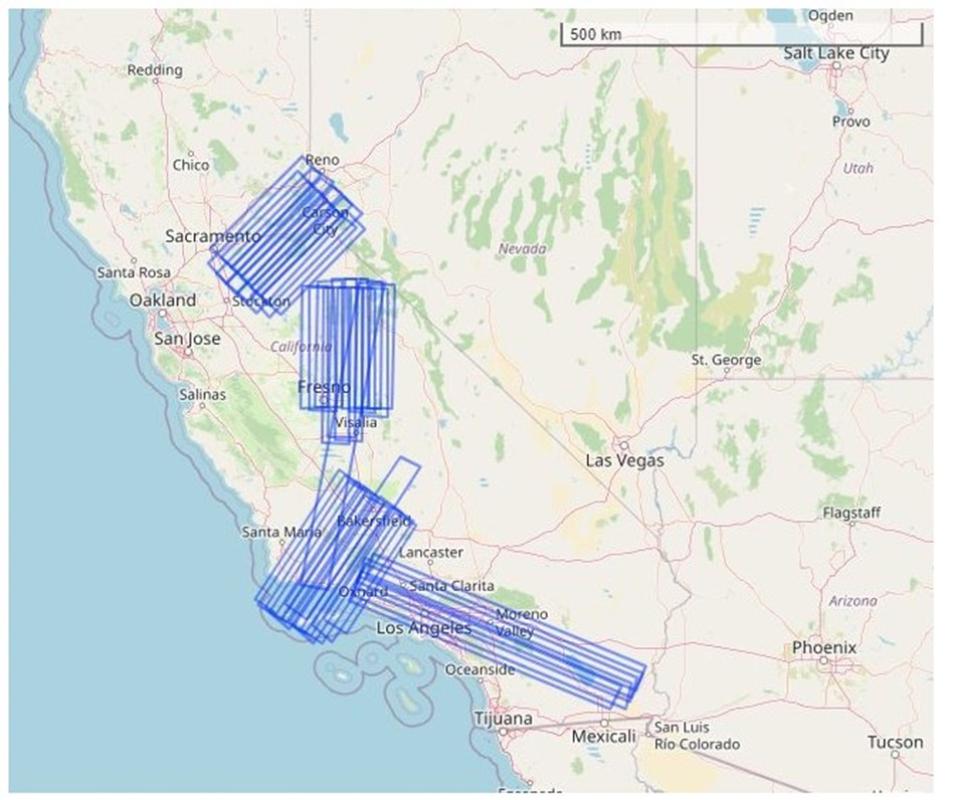
A map showing the the flight paths of NASA ER-2 aircraft, which carried the MASTER instrument, during the WTDS campaign.
Image Caption

During the WDTS campaign, the MASTER instrument was flown on NASA's ER-2 aircraft at altitudes of 19,500–20,360 meters above sea level. This image shows the ER-2's flight tracks over California and Nevada represented as rectangular polygons. Credit: ORNL DAAC. Basemap: © OpenStreetMap contributors.

Details

Last Updated

Published