Earth Science Data Roundup: December 2024

A summary of datasets, products, and resources released by NASA’s Distributed Active Archive Centers (DAACs) in November 2024.

Atmospheric Science Data Center (ASDC)

MAIA Surface Monitor Data Products Released

NASA's ASDC has released two Multi-Angle Imager for Aerosols (MAIA) Surface Monitor data products. These products include ground-based measurements of total PM2.5, total PM10, and chemically speciated PM2.5 (including sulfate, nitrate, elemental carbon, organic carbon, and dust) at various locations within MAIA’s globally distributed set of Primary Target Areas (PTAs). Applications of these data include air quality, climate, and epidemiological research.

Surface monitors are fixed-location, ground-based stations that provide accurate information about local levels and composition of outdoor particulate matter (PM). Measurements from these stations are used as "ground truth" for transforming MAIA satellite data into near-surface PM mass concentrations.

The Surface Monitor data products are provided in netCDF format and organized into individual files by PM type (total or speciated), with one file per day and per PTA containing measurements from particulate matter monitoring sites within that PTA. Each file includes both raw and quality-controlled data. Data coverage for total PM and speciated PM2.5 measurements begins in November 2022 and January 2021, respectively, though exact start dates may vary by target area and data source. The product files are regularly updated as new measurements become available, and this practice will continue through the end of the MAIA mission.

MAIA is a NASA instrument aboard a spacecraft provided by Agenzia Spaziale Italiana (ASI, the Italian Space Agency). Data from the observatory will be used in health studies to examine the health effects of various types of particulate air pollution.

Access MAIA data and more information:

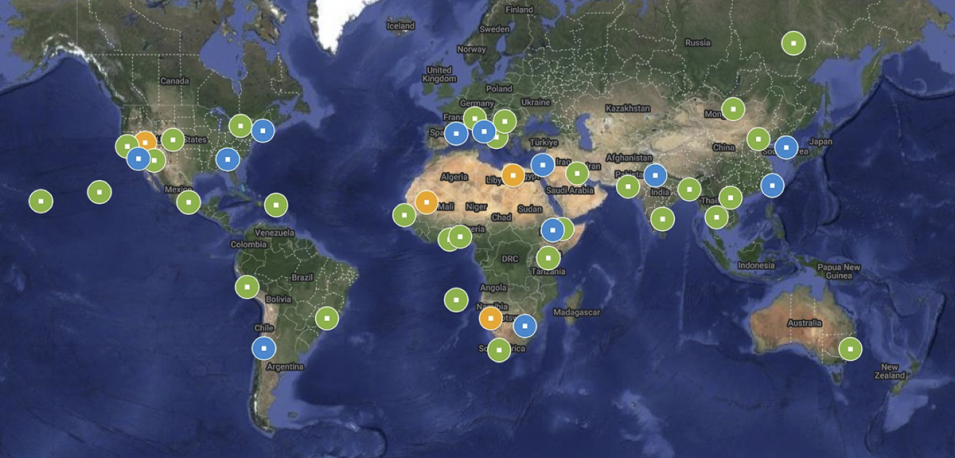
A world map is dotted with colorful circles, each indicating a primary target for the Multi-Angle Imager for Aerosols (MAIA) investigation.
Image Caption

NASA's MAIA instrument will view four types of globally distributed target areas from space. Primary Target Areas (PTAs, in blue on the map above) are large metropolitan areas where MAIA epidemiologists will study the impacts of various types of airborne particulate matter (PM) on human health. Secondary Target Areas (STAs, in green) are additional areas of scientific interest, including but not limited to research on air quality. Calibration/Validation Target Areas (CVTAs, in orange) are areas that will be observed routinely to check and maintain the accuracy of the MAIA instrument measurements and data products. MAIA will also view Targets of Opportunity (TOOs, not shown), which are episodic events such as wildfires, volcanic eruptions, etc., that affect air quality. Credit: NASA's Jet Propulsion Laboratory

Release D2 of the CERES A-Train Integrated CALIPSO, CloudSat, CERES, and MODIS (CCCM) Merged Dataset Now Available

The CERES A-Train Integrated CALIPSO, CloudSat, CERES, and MODIS (CCCM) Merged Release D2 dataset is now available from ASDC. The dataset is a highly fused Level 2 data product that uses observations from multiple instruments aboard several satellites in the Afternoon Train (or A-Train) to produce high-resolution vertical computed atmosphere fluxes. They include the Clouds and the Earth's Radiant Energy System (CERES) Flight Model 3 (FM3) and Moderate-Resolution Imaging Spectroradiometer (MODIS) on NASA’s Aqua satellite, the Cloud-Aerosol Lidar with Orthogonal Polarization (CALIOP) on the Cloud-Aerosol Lidar and Infrared Pathfinder Satellite (CALIPSO), and the Cloud Profiling Radar (CPR) aboard the CloudSat satellite.

The cloud and aerosol properties from CALIOP and cloud properties from the CPR are used to create high-resolution vertical profiles and sixteen horizontal groupings of clouds and aerosols that are then matched to a MODIS pixel and then convolved into Aqua CERES footprints. The product also contains variables from the Single Scanner Footprint (SSF) product, including CERES-derived top-of-atmosphere (TOA) shortwave (SW), longwave (LW), and window (WN) irradiances. Two sets of SSF variables are included in the CCCM data. One set uses imager data covering the entire CERES footprint, and the other uses only imager pixel data that matches with the CALIOP and CPR ground track. 

Access CCCM data and more information

Deep Space Climate Observatory (DSCOVR) Earth Polychromatic Imaging Camera (EPIC) Level 2 Multi-Angle Implementation of Atmospheric Correction (MAIAC) DAILY Version 1 Dataset Now Available

The DSCOVR EPIC Level 2 MAIAC Daily Version 01 dataset is now available from ASDC. The dataset contains plots generated from the DSCOVR EPIC Level 2 MAIAC Version 03 data product. The datasets visualized in the Level 2 MAIAC Daily product include Aerosol Layer Height (ALH), Aerosol Optical Depth (AOD), and Single Scattering Albedo at 340, 388, 443, 551, 680, and 780 nanometers.

The Level 2 MAIAC data provide an interdisciplinary suite of products for the EPIC instrument aboard the DSCOVR satellite. The version 03 dataset includes a range of atmosphere, land, and ocean products. The data provided at 10 km resolution on a zonal sinusoidal grid with a 1- to 2-hour temporal frequency. MAIAC version 03 data also provide gap-filled global composite products for the Normalized Difference Vegetation Index (NDVI) over land and water, leaving reflectance in 5 UV-Vis bands over the global ocean. The composite products represent a weighted running average where the weight of the latest observation is maximized toward the local noon and low aerosol conditions.

Access MAIAC data and more information

An image of Earth from the Earth Polychromatic Imaging Camera (EPIC) instrument aboard the Deep Space Climate Observatory (DSCOVR) satellite.
Image Caption

An image of Earth from the Earth Polychromatic Imaging Camera (EPIC) instrument aboard the Deep Space Climate Observatory (DSCOVR) satellite. DSCOVR resides in L1 orbit, which is the neutral gravity point between the Earth and Sun, approximately one million miles from Earth. Credit: NASA

Global Hydrometeorology Resource Center Distributed Active Archive Center (GHRC DAAC)

Total Precipitable Water (TPW) Dataset from the Convective Processes Experiment (CPEX) Field Campaign Released

NASA's GHRC DAAC released the Total Precipitable Water (TPW) CPEX dataset, which contains products obtained from the MetOp-B, NOAA-18, and NOAA-19 satellites. These data were collected supporting the NASA Convective Processes Experiment (CPEX) field campaign, which  occurred in the North Atlantic-Gulf of Mexico-Caribbean Sea region from May 25 to June 25, 2017. The CPEX campaign collected data to help explain convective storm initiation, organization, growth, and dissipation in the North Atlantic-Gulf of Mexico-Caribbean Oceanic region during the early summer of 2017. These data are available from May 24 through September 20, 2017, and are available in netCDF-4 format.

Access CPEX data and more information

Goddard Earth Sciences Data and Information Services Center (GES DISC)

Community Long-term Infrared Microwave Coupled Atmospheric Product System (CLIMCAPS) Pressure Level Version 2.1 Data Released

NASA's GES DISC and the Jet Propulsion Laboratory (JPL) Sounder Science Investigator-led Processing Systems (Sounder SIPS) released the Pressure Level Version 2.1 derived product for the Community Long-term Infrared Microwave Coupled Atmospheric Product System (CLIMCAPS). The product is based on CLIMCAPS products retrieved from data from the Atmospheric Infrared Sounder (AIRS) and Advanced Microwave Sounding Unit (AMSU) instruments aboard NASA's Aqua satellite; and from the Cross-track Infrared Sounder (CrIS) and Advanced Technology Microwave Sounder (ATMS) instruments on the Joint NASA-NOAA Suomi National Polar-orbiting Partnership (Suomi-NPP) satellite and the Joint Polar Satellite System's (JPSS) NOAA-20 satellite.

The CLIMCAPS v2.1 products were redesigned from the earlier CLIMCAPS v2 to include only the core fields directly retrieved in the CLIMCAPS algorithm, removing derived fields like those that were historically part of the Aqua AIRS/AMSU Science Team data collections.

Access CLIMCAPS v2.1 data and more information

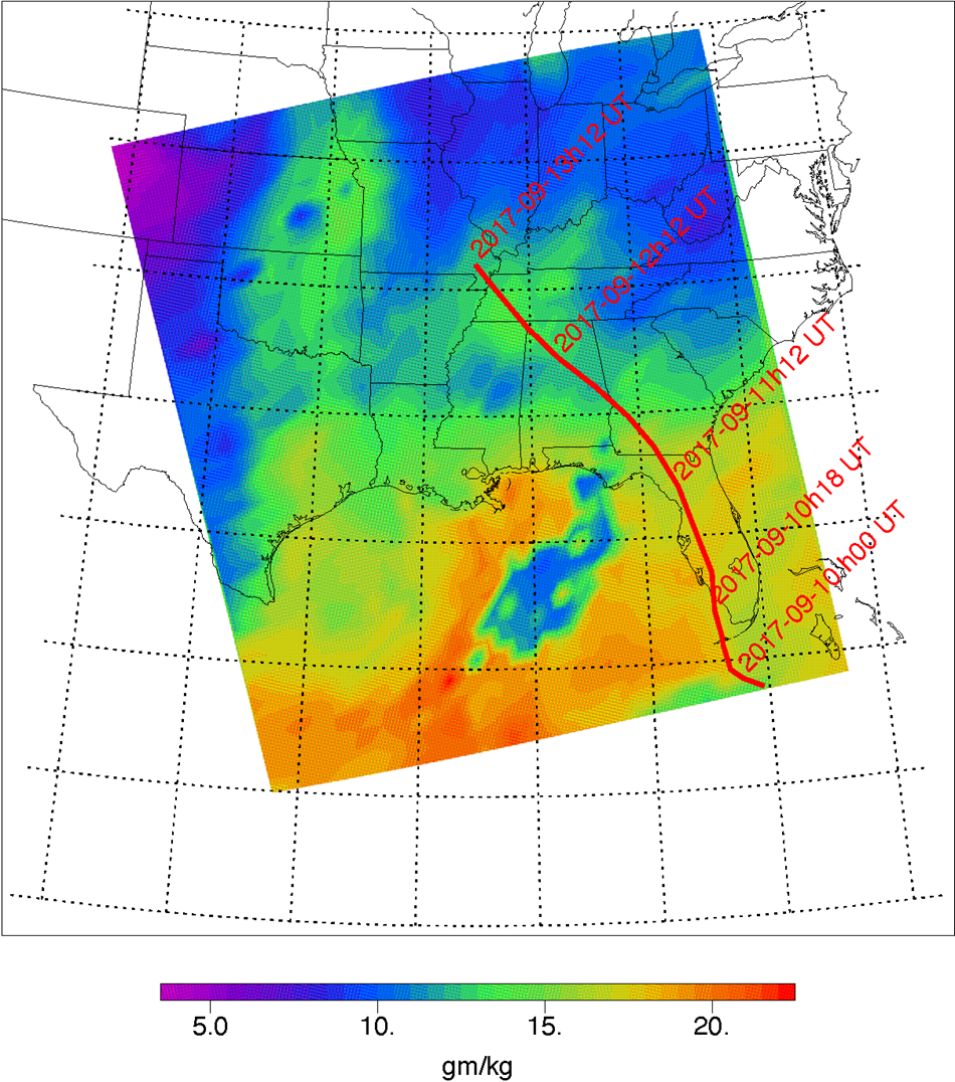
A visualization of near-surface specific humidity data over the southeastern United States on September 15, 2017 at 1900 UT. The data were derived from CrIS radiances on Suomi NPP satellite using the CLIMCAPS algorithm and the PLEV postprocessor.
Image Caption

This graphic shows near-surface specific humidity over the southeastern United States on September 15, 2017 at 1900 UT derived from CrIS radiances on Suomi NPP using the CLIMCAPS algorithm and the PLEV postprocessor. Two days prior, Hurricane IRMA crossed the region along the track shown by the red line, making landfall in southern Florida as a Category 4 hurricane before dissipating over western Tennessee as a tropical depression. Total rainfall in western Tennessee on September 13 was 8-10 inches. The image shows enhanced near-surface humidity over northern Alabama and western Tennessee that could have been caused by evaporation from wet soil and standing water left by the hurricane. Credit: GES DISC

GES DISC Announces Updates to the MERRA-2 Stratospheric Composition Reanalysis of Aura MLS (M2-SCREAM)

GES DISC and NASA’s  Global Modeling and Assimilation Office (GMAO) announced updates to the Modern-Era Retrospective analysis for Research and Applications-2 (MERRA-2) Stratospheric Composition Reanalysis of Aura Microwave Limb Sounder (M2-SCREAM). This stratosphere-focused chemical reanalysis provides global three-dimensional fields of ozone, water vapor, hydrogen chloride (HCl), nitric acid (HNO3), and nitrous oxide (N2O) mixing ratios, all of which are of primary importance to stratospheric chemistry and transport studies. These mixing ratios are generated by assimilating Microwave Limb Sounder (MLS) and Ozone Monitoring Instrument (OMI) retrievals into the Goddard Earth Observing System (GEOS) Constituent Data Assimilation System driven by meteorological fields from MERRA-2.

The updates include:

  • The MLS team began to “duty-cycle” the 190-GHz measurements. This affects the availability of H2O, N2O, and to a lesser extent HNO3 retrievals. (May 2024)
  • M2-SCREAM switched from assimilating MLS version 4.2 to version 5.0 retrievals for all five analyzed species, as version 4.2 is no longer produced. Users will observe discontinuities in assimilated H2O throughout the stratosphere and N2O in the lower stratosphere. (June 2024)

Access M2-SCREAM data and more information

Land Processes Distributed Active Archive Center (LP DAAC)

Gap Filled MODIS Version 6.1 Albedo, BRDF, and NBAR Data Product Released

NASA's LP DAAC released the Terra+Aqua Combined Moderate Resolution Imaging Spectroradiometer (MODIS) Version 6.1 Bidirectional Reflectance Distribution Function and Albedo (BRDF/Albedo) Gap-Filled Snow-Free Daily L3 Global 30ArcSec Climate Modelling Grid (CMG) data product. This product includes Albedo, Bidirectional Reflectance Distribution Function (BRDF), and Nadir BRDF-Adjusted Reflectance (NBAR) data. Currently, the collection only contains data from 2013 through 2021. The remaining historic data will be added at a later date.

Access MODIS Version 6.1 data and more information

More ECOSTRESS Tiled Data Added to AppEEARS

LP DAAC has announced that Version 3.66 of the Application for Extracting and Exploring Analysis Ready Samples (AppEEARS) adds four ECOsystem Spaceborne Thermal Radiometer Experiment on Space Station (ECOSTRESS) Tiled data products. They are:

  • ECOSTRESS Tiled Ancillary NDVI and Albedo L2 Global 70 m (ECO_L2T_STARS.002)
  • ECOSTRESS Tiled Surface Energy Balance Instantaneous L3 Global 70 m (ECO_L3T_SEB.002)
  • ECOSTRESS Tiled Downscaled Soil Moisture Instantaneous L3 Global 70 m (ECO_L3T_SM.002)
  • ECOSTRESS Tiled Downscaled Meteorology Instantaneous L3 Global 70 m (ECO_L3T_MET.002)

A complete listing of data products available in AppEEARS can be found on the Available Products list.

Learn more about the ECOSTRESS datasets available in AppEEARS

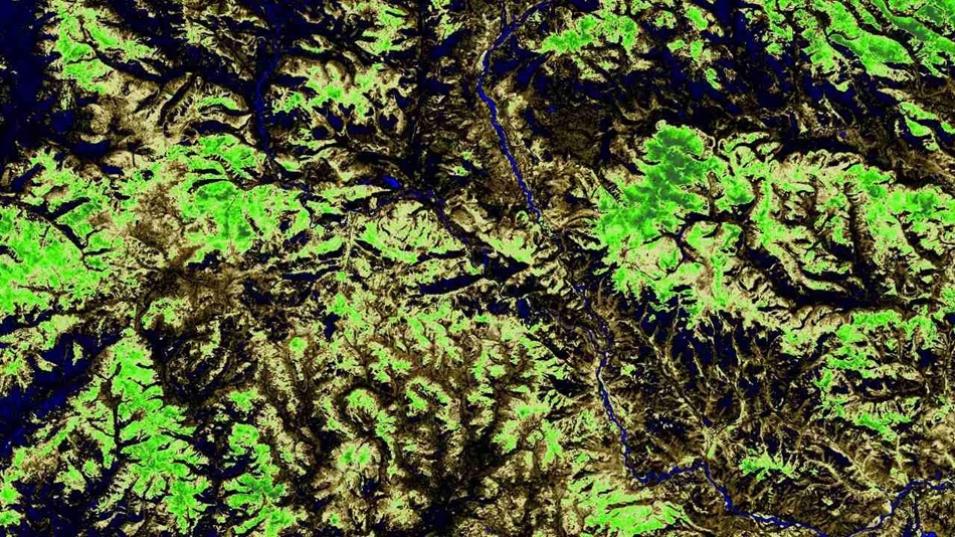
A visualization of Normalized Difference Vegetation Index (NDVI) data over northern Mongolia on October 20, 2023.
Image Caption

This image shows Normalized Difference Vegetation Index (NDVI) data over northern Mongolia from the ECO_L2T_STARS V002 ECOSTRESS product on October 20, 2023. Green areas indication healthy vegetation whereas brown areas indicate areas of no vegetation and/or bare soil. Credit: LP DAAC

LP DAAC Releases Landsat-Derived Global Rainfed and Irrigated-Cropland Product at 30 meters (LGRIP30) Version 2 Data Products

Five new Landsat-Derived Global Rainfed and Irrigated-Cropland Product at 30 meters (LGRIP30) Version 2 data products for the nominal year 2020 are now available from NASA's LP DAAC. The five new products are:

LGRIP30 products provide high-resolution, global cropland data to assist and address food and water security issues. New Level 1 and Level 2 irrigation and rainfed data products subdivide their respective cropland types to provide greater detail in cropland spatial distribution. 

LGRIP30 Version 2 data are produced using Landsat 8 time-series satellite sensor data for the 2019 through 2021 time period to create nominal 2020 products. The LGRIP Version 1 collection will remain available as it contains data for nominal year 2015. Improvements and changes introduced in Version 2 include:

  • Data overcomes uncertainties present in LGRIP30 V1 by increasing accuracies and reducing errors of omission and commission.
  • Data represents the nominal year 2020; LGRIP30 V1 was for the nominal year 2015.
  • Introduced Level 1 and Level 2 provide more detail for irrigated areas and rainfed areas. Level 1 data provides the greatest detail and classification for irrigated and rainfed croplands, while Level 2 data provides aggregated Level 1 data for irrigated and rainfed areas.

Access LGRIP30 data and more information

NASA MEaSUREs CAMEL Climatology V3 Products Now Available

NASA's Making Earth System Data Records for Use in Research Environments (MEaSUREs) Combined ASTER and MODIS Emissivity database over Land (CAMEL) Version 3 (V003) Climatology product suite is now available from LP DAAC.

These products are based on the CAMEL V003 monthly data products with similar spectral coverage and spatial resolution over the years 2003 through 2021. The climatology is reported for every calendar month and includes:

  • Combined ASTER and MODIS Emissivity database over Land (CAMEL) Emissivity Climatology Monthly Global 0.05Deg V003 (CAM5K30EMCLIM.003)
  • Combined ASTER and MODIS Emissivity database over Land (CAMEL) Coefficient Climatology Monthly Global 0.05Deg V003 (CAM5K30CFCLIM.003)
  • Combined ASTER and MODIS Emissivity database over Land (CAMEL) Uncertainty Climatology Monthly Global 0.05Deg V003 (CAM5K30UCCLIM.003)
  • Combined ASTER and MODIS Emissivity database over Land (CAMEL) Covariances Climatology Monthly Global 0.05Deg V003 (CAM5K30COVCLIM.003)

Access CAMEL Climatology V3 data and more information

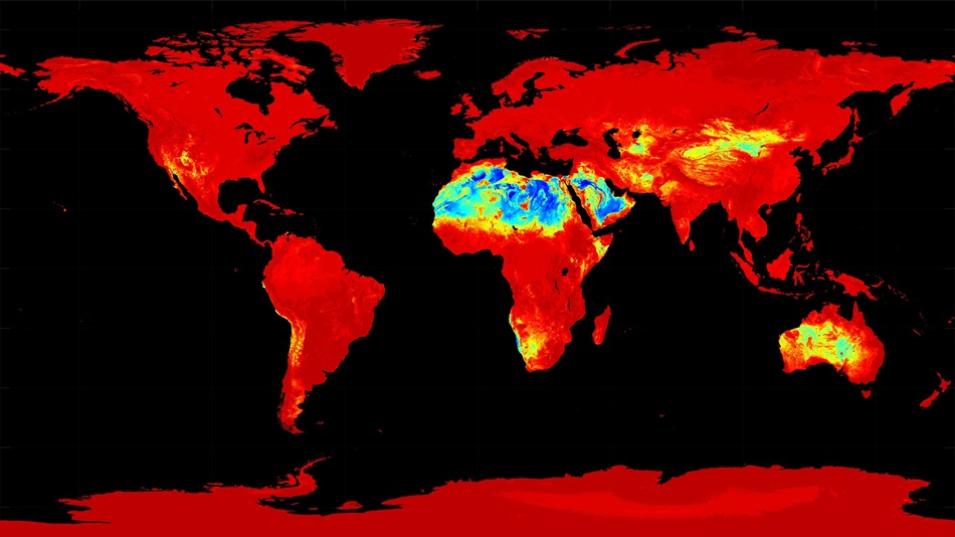
A visualization of data from the Combined ASTER and MODIS Emissivity database over Land (CAMEL) Emissivity Climatology Monthly Global 0.05Deg V003 data product.
Image Caption

This image shows data from the Combined ASTER and MODIS Emissivity database over Land (CAMEL) Emissivity Climatology Monthly Global 0.05Deg V003 data product. Land Surface Temperature and Emissivity data are critical variables for monitoring the long-term effects of climate change and studying a variety of Earth surface processes and surface-atmosphere interactions such as evapotranspiration, surface energy balance and water vapor retrievals. Credit: LP DAAC

LPJ-EOSIM July 2024 Low Latency Data Replaced

NASA's LP DAAC has announced that, due to issues with the European Centre for Medium-Range Weather Forecasts (ECMWF) Re-Analysis (ERA5) driver in July 2024, LPJ-EOSIM ERA5 and ensemble mean estimates of wetland methane data products have been revised. 

Impacted granules from July 1, 2024, to July 31, 2024, in LPJ-EOSIM Level 2 Global Simulated Daily Wetland Methane Flux Low Latency (LPJ_EOSIM_L2_DCH4E_LL) and LPJ-EOSIM Level 2 Global Simulated Monthly Wetland Methane Flux Low Latency (LPJ_EOSIM_L2_MCH4E_LL) data products were replaced on November 13, 2024.

Users who downloaded July 2024 data prior to November 13, 2024, are advised to download the updated data files.

Learn more about updated data files for July 2024 LPJ-EOSIM products

Level 1 and Atmosphere Archive and Distribution System Distributed Active Archive Center (LAADS DAAC)

Aqua MODIS CLDPROPCOSP (v1.1) Level 3 Daily and Monthly Products Reprocessed

NASA's LAADS DAAC has reported that all of the Aqua MODIS CLDPROPCOSP (v1.1) Level 3 daily and monthly data products from 2002 to 2022 were reprocessed to fix missing science datasets. The affected product shortnames for these two collections include CLDPROPCOSP_D3_MODIS_Aqua and CLDPROPCOSP_M3_MODIS_Aqua. Users are advised to check the production date (year and day-of-year) to ensure they have the newly corrected version of these products.

Learn more about reprocessed Aqua MODIS CLDPROPCOSP data products

Discontinuation of .met files from Near-Real Time

LAADS DAAC has reported that the ingest and distribution of the .met files from near real-time has been disabled since November 4, 2024. Users who need these files for determining granule bounding coordinates for all Level 1 and Level 2 Swath products can use the GeoMeta files from Terra and Aqua.

For everything else, the same metadata attributes can be extracted by parsing the relevant product file itself. 

Learn more about the discontinuation of .met files from near real-time

National Snow and Ice Data Center Distributed Active Archive Center (NSIDC DAAC)

SMAP/CYGNSS EASE-Grid Soil Moisture, Version 1 Dataset Now Available

NASA’s NSIDC DAAC released the SMAP/CYGNSS EASE-Grid Soil Moisture, Version 1 dataset. The main parameter of this dataset is surface soil moisture presented on the Global EASE-Grid 2.0 projection, with each data point representing the top 5 centimeters of the soil column. The dataset is derived by downscaling Soil Moisture Active Passive (SMAP) enhanced Level-3 9-kilometer brightness temperatures (TB) using Cyclone Global Navigation Satellite System (CYGNSS) reflectivity data and employing a slightly modified version of the baseline SMAP active-passive TB algorithm.

Access the SMAP/CYGNSS EASE-Grid Soil Moisture dataset and more information

GLIMS Glacier Database, Version 1 Dataset Updated

The Global Land Ice Measurements from Space (GLIMS) Glacier Database Version 1 dataset available at NASA's NSIDC DAAC has been updated. This update includes new outlines for various regions and periods in Antarctica, Norway, the Andes, and the Himalayas. Other changes include updated attributes and retired glacial outlines in the subantarctic, and several glaciers in the low-latitude Andes now classified as extinct. 

The GLIMS database is a comprehensive glacier inventory that provides information about the extent and rate of change of all the world's mountain glaciers and ice caps. It uses data from the Advanced Spaceborne Thermal Emission and Reflection Radiometer (ASTER) instrument aboard the Terra satellite, the Landsat satellite series, and historical observations. The dataset is produced in coordination with the GLIMS initiative and covers the period from January 1, 1850, to the present.

Access the GLIMS Glacier Database and more information

New NASA Earthdata Cloud Access Option for the SMAP Collection Available on December 3, 2024

NASA's NSIDC DAAC will add 22 datasets from the Soil Moisture Active Passive (SMAP) collection to NASA's Earthdata Cloud on December 3, 2024. Earthdata Cloud is NASA’s archive of Earth observations, hosted in Amazon Web Services (AWS). While these datasets will continue to be available via their current URLs and workflows, these legacy access methods will be retired soon. Users are encouraged to update their direct download workflows, including any data download scripts, to use the new Earthdata Cloud HTTPS location after December 3, 2024. The Earthdata Cloud HTTPS data access URL will be available from each data set landing page using the HTTPS File System link under Data Access and Tools after the publication date.

Learn more about SMAP data in the cloud

Sea Ice Concentrations from Nimbus-7 SMMR and DMSP SSM/I-SSMIS Passive Microwave Data, Version 2 Dataset Updated

The Sea Ice Concentrations from Nimbus-7 Scanning Multichannel Microwave Radiometer (SMMR) and DMSP Special Sensor Microwave Imager/Sounder (SSMIS) Passive Microwave Data, Version 2 dataset available from NSIDC DAAC has been updated through June 30, 2024. This dataset is generated from brightness temperature data and is designed to provide a consistent time series of sea ice concentrations spanning the coverage of several passive microwave instruments. The data are provided in the polar stereographic projection at a grid cell size of 25 x 25 kilometers.

Access the Sea Ice Concentrations Version 2 dataset and more information

AMSR-E/AMSR2 Unified Level 3 Global Daily/Weekly/Monthly Ascending and Descending .25x.25 deg Ocean Grids, Version 1 Datasets Released

NSIDC DAAC has released the Global Daily Ascending/Descending .25x.25 deg Ocean Grids, Version 1, AMSR-E/AMSR2 Unified L3 Global Weekly Ascending/Descending .25x.25 deg Ocean Grids, Version 1, and AMSR-E/AMSR2 Unified L3 Global Monthly Ascending/Descending .25x.25 deg Ocean Grids, Version 1 datasets.

These datasets report daily, weekly, and monthly estimates of water vapor, cloud liquid water content, and surface wind speed over the ocean, on a global 0.25° × 0.25° resolution grid. AMSR Unified data are generated from Advanced Microwave Scanning Radiometer (AMSR), (AMSR-E), and AMSR2 data that have been resampled to intercalibrate (i.e., unify) the instruments. Temporal coverage for each dataset spans from June 2002 to the present, with a gap of data between the end of the AMSR-E mission on October 4, 2011, and the beginning of AMSR2 coverage on July 2, 2012. The data are derived from the AMSR-E/AMSR2 Unified Level 2B Global Swath Ocean Products, Version 1 dataset.

Access AMSR-E/AMSR2 datasets and more information

High Mountain Asia Daily 5 Kilometer Landslide Hazard Indicator, Version 1 Dataset Updated

The High Mountain Asia Daily 5km Landslide Hazard Indicator, Version 1 dataset has been updated and is available at NSIDC DAAC. This update adds landslide hazard indicators (LHIs) for 1990 through 2014, retrodicted using the same 30-member ensemble climate model used to project LHIs through 2100.

This dataset contains projections of the daily hazard of rainfall-triggered landslides in the High Mountain Asia region from 2015 through 2100 at 5-kilometer resolution for two Shared Socioeconomic Pathways (SSPs) — SSP2-4.5 and SSP5‑8.5 — based on downscaled temperature and precipitation projections from a 30-member ensemble climate model. Also included are two historical LHI datasets: LHIs generated from a machine learning model trained on historical temperatures, precipitation, and documented landslides for 1990 through 2019, and the newly added retrodicted LHIs based on downscaled temperatures and precipitation from the same climate model used for the projections.

Access the High Mountain Asia Daily 5 Kilometer Landslide Hazard Indicator dataset and more information

NASA Earthdata Harmony Data Transformation Services Now Available for Select ATLAS/ICESat-2 Datasets

Data transformation services through Earthdata Harmony are now available for 8 Advanced Topographic Laser Altimeter System (ATLAS)/Ice, Cloud, and Land Elevation Satellite-2 (ICESat-2) datasets archived at NSIDC DAAC. Spatial and temporal subsetting services are now available for the following datasets:

  • ATLAS/ICESat-2 L2A Global Geolocated Photon Data, Version 6 (ATL03)
  • ATLAS/ICESat-2 L2A Normalized Relative Backscatter Profiles, Version 6 (ATL04)
  • ATLAS/ICESat-2 L3A Land Ice Height, Version 6 (ATL06)
  • ATLAS/ICESat-2 L3A Sea Ice Height, Version 6 (ATL07)
  • ATLAS/ICESat-2 L3A Land and Vegetation Height, Version 6 (ATL08)
  • ATLAS/ICESat-2 L3A Calibrated Backscatter Profiles and Atmospheric Layer Characteristics, Version 6 (ATL09)
  • ATLAS/ICESat-2 L3A Ocean Surface Height, Version 6 (ATL12)
  • ATLAS/ICESat-2 L3A Along Track Inland Surface Water Data, Version 6 (ATL13)

Earthdata Harmony allows users to subset NASA data available in Earthdata Cloud to their specific spatial and temporal regions of interest. Users can access Earthdata Harmony through the NASA Earthdata Search interface or programmatically via Harmony’s API or harmony-py Python library. Data processed by Harmony can be accessed directly in the cloud or downloaded to a local computer for further analysis. 

For information on how to start using Earthdata Harmony in Earthdata Search, see the article Search, order, and customize NSIDC DAAC data with NASA Earthdata Search.

Learn more about Earthdata Harmony transformation services
Oak Ridge National Laboratory Distributed Active Archive Center (ORNL DAAC)

Monthly Solar-Induced Chlorophyll Fluorescence (SIF) Estimates from the TROPOspheric Monitoring Instrument (TROPOMI) over the Arctic Ocean, 2004-2020 Dataset Released

NASA’s ORNL DAAC released the Monthly Solar-Induced Chlorophyll Fluorescence (SIF) Estimates from the TROPOspheric Monitoring Instrument (TROPOMI) over the Arctic Ocean, 2004-2020 dataset, which provides SIF estimates over the Arctic Ocean at a 0.05-degree resolution for each month from January 2004 through December 2020. SIF data from TROPOMI (2018 to 2021) were extended over the study period using a random forest machine learning model trained using TROPOMI SIF climatological records. These data are useful for monitoring the physiological responses of phytoplankton to ongoing climate change over this ocean region. The data are provided in cloud optimized GeoTIFF (COG) format.

Access SIF estimates from TROPOMI over the Arctic Ocean and more information

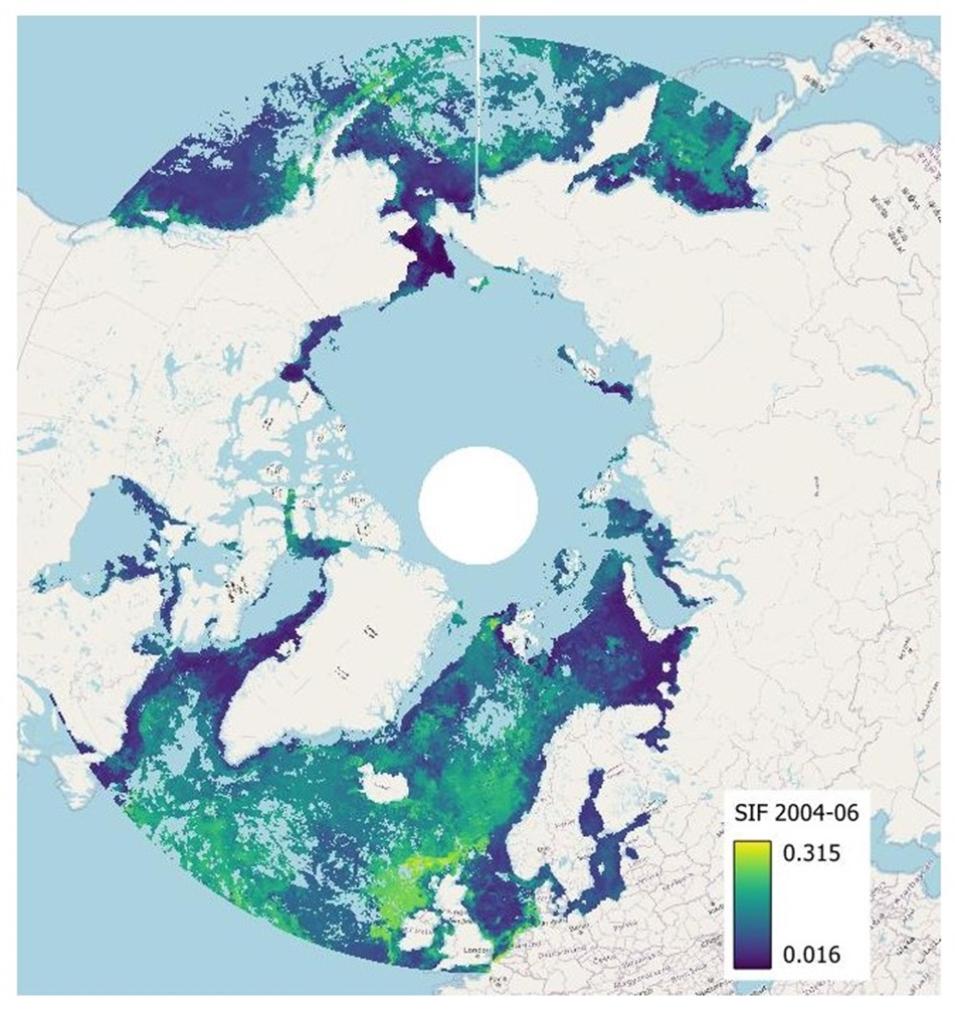
This visualization shows the monthly average of Solar-Induced Chlorophyll Fluorescence (SIF) Estimates from TROPOMI instrument over the Arctic Ocean for 2004 to 2006. The brighter colors indicate areas of greater net primary production in the Arctic Ocean. Credit: ORNL DAAC
Image Caption

The Monthly Solar-Induced Chlorophyll Fluorescence (SIF) Estimates from TROPOMI over the Arctic Ocean, 2004-2020 dataset provides SIF estimates over the Arctic Ocean at a 0.05-degree resolution for each month from January 2004 through December 2020. Applications of this dataset are expected to provide new insights into how phytoplankton respond across time and space to environmental shifts and to contribute to a more nuanced understanding of their role in shaping high-latitude marine ecosystems. Shown here is the monthly average SIF for Arctic Ocean for 2004 to 2006. The brighter colors indicate areas of greater net primary production in the Arctic Ocean. Credit: ORNL DAAC

Delta-X: Numerical Understanding of Marsh Accretion Resilience (NUMAR) Soil Accretion Modeled to 2100, Mississippi River Delta, Louisiana Dataset Now Available

The Delta-X: NUMAR Soil Accretion Modeled to 2100, Mississippi River Delta, Louisiana dataset is now available from NASA's ORNL DAAC. This dataset provides modeled estimates of soil accretion for the Atchafalaya and Terrebonne basins in the Mississippi River Delta of coastal Louisiana. Soil accretion was predicted from 2021 to 2100 using the Marsh Accretion Rates (NUMAR) process model. The input parameters were aggregated within ecogeomorphic cells, areas of similar vegetation, and elevation. The dataset includes spatially explicit input values, description of important parameters, and a shapefile of model outputs.

The Delta-X field campaign uses airborne (remote sensing) and field (in situ) measurements to look at the water, vegetation, and sediment (soil) to understand how the Mississippi River Delta is changing.

Access the Delta-X Numerical Understanding of Marsh Accretion Resilience (NUMAR) Soil Accretion Modeled to 2100, Mississippi River Delta, Louisiana dataset and more information

Delta-X: Matlab Model for Wax Lake Delta Land Accretion Dataset Released

NASA's ORNL DAAC released the Delta-X: Matlab Model for Wax Lake Delta Land Accretion dataset, which provides the Matlab sediment transport and land accretion model at the Wax Lake Delta (WLD) in the Atchafalaya Basin of coastal Louisiana. The data include the Matlab scripts that solve the advection and Exner equations to simulate the suspended sediment transport and accretion at WLD. The main code calculates suspended sediment fluxes and accretion rates of mud and sand as a function of space and time. The cumulative sediment accretion from each campaign was then used to estimate an annualized land accretion map using a weighted-average formula. The final product, the one-year upscaled land accretion map, is archived as a separate dataset.

Access the Delta-X: Matlab Model for Wax Lake Delta Land Accretion dataset and more information

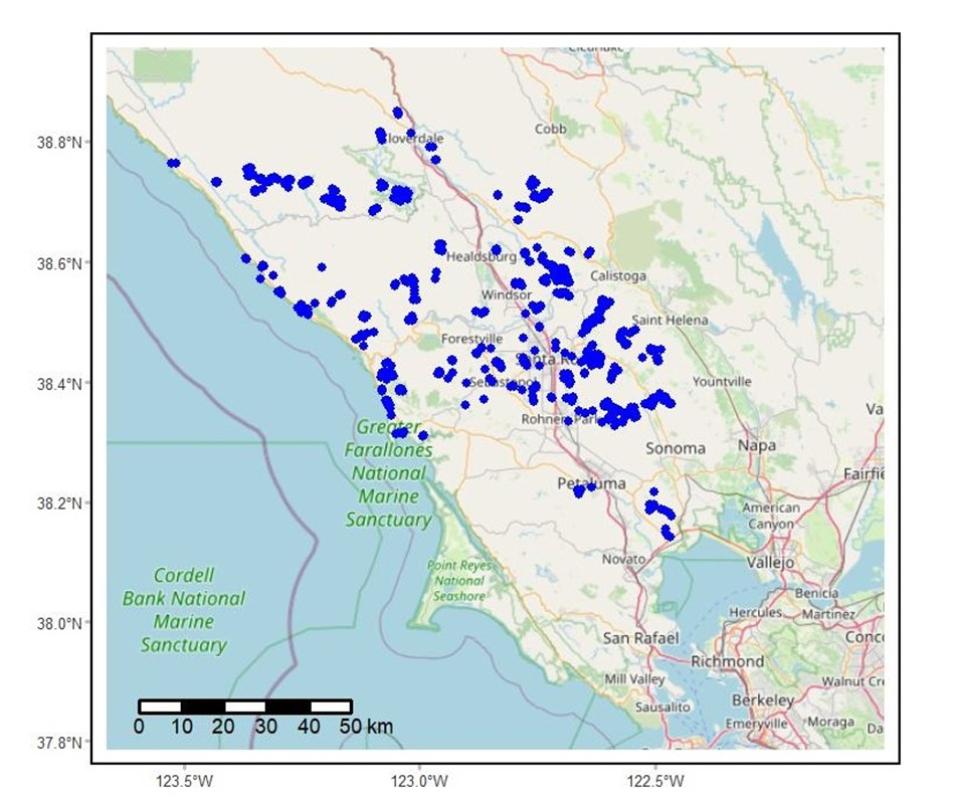
Soundscapes to Landscapes Acoustic Recordings, Sonoma County, California, 2017-2022 Dataset Now Available

The Soundscapes to Landscapes Acoustic Recordings, Sonoma County, California, 2017-2022 dataset is now available from the ORNL DAAC. This dataset holds in situ sound recordings from 1,399 sites in Sonoma County, California, as part of the Soundscapes to Landscapes citizen science project. Recordings were collected from 2017 to 2022 during the bird breeding season (mid-March through mid-July). Sites were selected across the county; locations were stratified with respect to topographic position and broad land use/land cover types, such as forest, shrubland, herbaceous, urban, agriculture, and riparian areas. Each recording is saved in a waveform audio file format (.wav) and the dataset includes information including site location (when permitted by landowners) in tabular form and photographs of the field sites.

Access the Soundscapes to Landscapes Acoustic Recordings, Sonoma County, California, 2017-2022 dataset and more information

The blue dots shown in this image represent the locations of the study sites established for the Soundscapes to Landscapes citizen science project, which captured in situ landscape sound recordings throughout Sonoma County, California between 2017 and 2022.
Image Caption

The Soundscapes to Landscapes Acoustic Recordings, Sonoma County, CA, 2017-2022 dataset holds in situ sound recordings from 1,399 sites in Sonoma County, California, USA as part of the Soundscapes to Landscapes citizen science project. The locations of the sites, represented in this image by the blue dots, were stratified with respect to topographic position and broad land use/land cover types, such as forest, shrubland, herbaceous, urban, agriculture, and riparian areas. Credit: ORNL DAAC

SiB4 Modeled 0.5-degree Carbonyl Sulfide Vegetation and Soil Fluxes, 2000-2020 Dataset Released

NASA's ORNL DAAC released the SiB4 Modeled 0.5-degree Carbonyl Sulfide Vegetation and Soil Fluxes, 2000-2020 dataset. This dataset provides outputs from the Simple Biosphere Model (v 4.2). Products include hourly 0.5-degree gridded fluxes of gross primary productivity, respiration, carbonyl sulfide (COS) uptake by vegetation and soil, along with conductance of COS (apparent mesophyll and total), stomatal conductance of water and partial pressure of CO2 in the canopy air space, leaf surface, interior, and chloroplast. The data are separated by plant functional type. Fluxes have dimensions of latitude, longitude, time, and plant functional type. Model output spans 53N to 90N latitude and 180W to 180E longitude over years 2000 to 2020. The data are provided in netCDF version 4 format.

Access the SiB4 Modeled 0.5-degree Carbonyl Sulfide Vegetation and Soil Fluxes, 2000-2020 dataset and more information

Details

Last Updated

Published

Data Center/Project

Atmospheric Science Data Center (ASDC)
Global Hydrometeorology Resource Center DAAC (GHRC DAAC)
Level 1 and Atmosphere Archive and Distribution System DAAC (LAADS DAAC)
Land Processes DAAC (LP DAAC)
National Snow and Ice Data Center DAAC (NSIDC DAAC)
Airborne and Field Data Resource Center
Goddard Earth Sciences Data and Information Services Center (GES DISC)
Oak Ridge National Laboratory DAAC (ORNL DAAC)