Dr. Carmen Boening

The Global Sea Level Change portal is NASA’s home for sea level change data and information. As the portal’s principal investigator, Dr. Boening ensures that it remains a key resource for both scientists and the general public.

For Dr. Carmen Boening, sea level change is personal. As the principal investigator (PI) for NASA’s Sea Level Change portal, she leads the team that maintains the portal as a collaborative platform for sea level change research. The portal was established in 2013, and features data, animations, articles, mission profiles, and a wealth of easy-to-interpret charts, tables, and graphs.

The launch of the Sentinel-6 Michael Freilich ocean altimetry satellite mission not only continues a satellite ocean altimetry record stretching back to the early-1990s, but will open new frontiers of research through its improved instrumentation and the availability of its data via the portal. Dr. Boening is quick to note that while the portal originally was developed to bring together the various science disciplines involved in sea level change studies, it is a resource designed for anyone ready for a deep dive into learning more about sea level change.

What is the NASA Sea Level Change portal, why was it created, and who are the contributors to the site?

Sea level is an interdisciplinary problem involving a lot of different systems. Glaciers are melting and releasing water into the oceans; ocean circulation leads to regional differences; the hydrology of rivers and lakes are all contributing. It’s a very complex problem.

With the [establishment of the] NASA Sea Level Change Science Team, NASA wanted to increase the collaboration between the different disciplines that contribute sea level change data and research. There are a lot of science disciplines, like glaciology or space geodesy, that are within NASA and where we uniquely contribute. We created the Sea Level Change portal so that people have easier access to exchanging information between, say, glaciologists and oceanographers and hydrologists. The portal is a place where we can come together and collaborate.

The data on the Sea Level Change portal come mainly from NASA [Earth Observing System Data and Information System] DAACs [Distributed Active Archive Centers]. We bring together the data that are stored, for example, at PO.DAAC [NASA’s Physical Oceanography DAAC] or NSIDC DAAC [NASA’s National Snow and Ice Data Center DAAC] and make them accessible through the portal so every NASA sea level-related dataset is available in one place.

The Sea Level Change portal is also the website that specifically represents and highlights the science of NASA's Sea Level Change Science Team. The science team [principal investigators] contribute to the portal’s content, to the data, and all the latest and greatest knowledge that we are sharing.

I’ve been looking through the portal and see that there is a lot of new content. What can visitors to the portal discover?
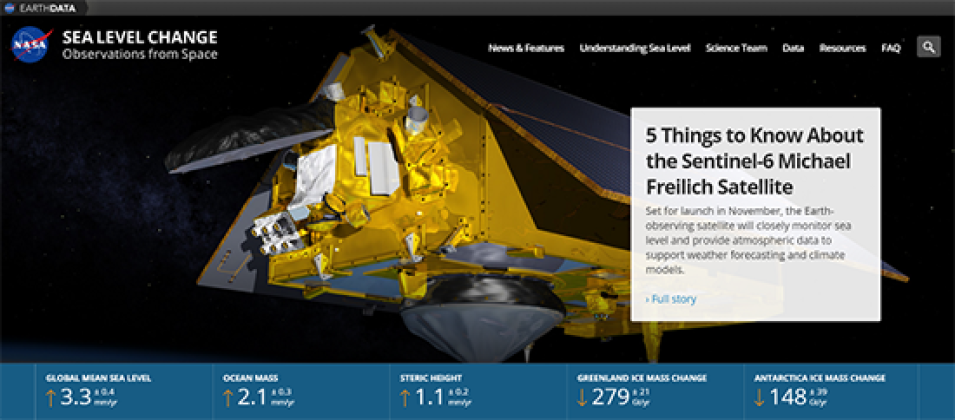
Screenshot of the home page of the Sea Level Portal
Image Caption

The Sea Level Change portal home page features an easy to navigate menu and metrics providing key global sea level change information. Image: NASA JPL/Sea Level Change Science Team.

We try to make it easy for people to find the information they need. Along with sea level-related data, we provide metrics for indicators of sea level change. For example, we get data from the DAACs like satellite altimetry data and the global mean sea level and we have this on the front page. You can quickly see how the global mean sea level is changing over time, you can see what the trend is, and all the elements that contribute to what you’re seeing.

Other contributions on the site include news articles. When scientists on the team publish their science articles, people want to know about this without necessarily having a subscription to a science journal. We have a science writer on our team who works with the scientists to translate their scientific results into accessible short articles. We try to link these articles to all the data and tools that we have on the portal.

Another interesting part of the portal is the tools section where people can play around with the different datasets and compare datasets to try to learn about what’s happening with sea level on a more regional scale and get insights into the processes behind these changes.

Is the site designed specifically for scientists or does it have benefits for the general public?

That’s an interesting question because we originally thought about the portal as a place for scientists to collaborate and exchange information – get the glaciologists on the same page, literally, as the oceanographers.

But now, we’re so advanced in our collaborations that we really think we contribute a lot to what the general public wants to know. People care about what happens to sea level in their back yard. They can come to the portal to learn more.

We have a tool release coming up where people can click on a tide gauge location near them and see how sea level has been changing over time, learn about what’s contributing to these changes, and click on links to pages describing what these different processes are. In particular, this new tool will provide insights into what global NASA measurements and data are indicating about sea level change on regional and local scales.

That’s a great lead in, so let’s talk about sea level change. What do the data indicate about sea level change and the rate of this change?

sea graph
Image Caption

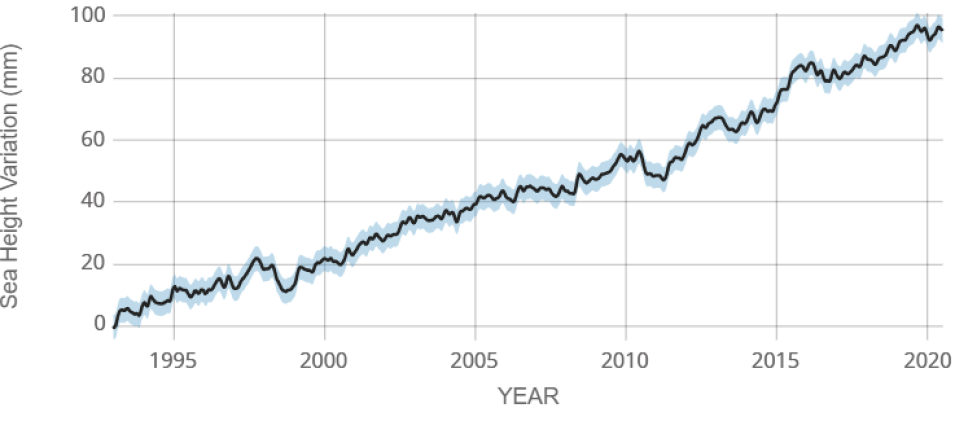
Graph of sea height variation over time as measured by altimeters aboard Earth observing satellites from January 5, 1993, to July 6, 2020. The global mean sea level is rising at approximately 3.3 mm per year. Credit: NASA’s Goddard Space Flight Center/NASA’s PO.DAAC. Graph available at NASA’s Sea Level Change portal.

There are different elements to this. One dataset that we report on the portal is the global mean sea level change, which is the overall change in sea level averaged over the entire ocean. This rate of change is currently about 3.3 mm per year.

This doesn’t sound like much, but you also have to look at regional changes too because of effects from things like ocean circulation, ice melting, and changes in Earth’s gravity field and mass concentrations. Now imagine you have one foot of global sea level change on a local level and then you have a major hurricane or typhoon on top of this. All of a sudden that extra foot of higher average local sea level becomes very significant. Anything that’s happening regionally gets amplified quite a lot.

Are there some regions experiencing greater effects or impacts from sea level change than others? If so, where are these and why are their impacts greater?

The regional differences in impacts from sea level change are not just due to oceanographic differences in these areas, but also to what is happening to the land. Some coastal areas experience subsidence, so the land is sinking over time. In these areas the ocean gets higher with respect to the land.

We see with our satellite gravity missions that ice sheets are losing mass. These ice sheets are melting and water gets moved from that part of the land to the ocean. This means that the ice sheet on land is getting lighter. If a massive object like an ice sheet is lighter, it has a less significant gravitational effect. Around Greenland, for example, there is a decrease in regional sea level due to changes in gravity as mass is lost from ice sheets melting. We see drops and rises in sea level in different regions for different reasons.

Speaking of gravity, your area of specialization is satellite gravity missions, especially the Gravity Recovery and Climate Experiment [GRACE] and GRACE-Follow On [GRACE-FO] missions. How do these gravity-related missions provide information about sea level change?

GRACE [operational 2002 to 2017] and GRACE-FO [operational 2018 to present] measure Earth’s gravity field. The twin GRACE and GRACE-FO satellites follow one another in orbit and track changes in the distance between one another with extremely high precision. [Editor's note: GRACE-FO measures changes in distance between the two satellites to the precision of one micron – about the diameter of a human blood cell or roughly 70 times smaller than the width of an average human hair.]

If you imagine a place on Earth that has more mass and a greater gravitational pull, the first satellite comes along and gets attracted. The second satellite is further behind and not attracted, so the distance between the satellites increases. Then the second satellite flies over the same point and gets pulled closer to the concentration of mass and the distance between the two satellites then decreases. Measuring these slight changes in distance between the two satellites tells us what is going on at the surface.

Basically, we have a scale in the sky with GRACE and GRACE-FO and we can weigh the elements of Earth. The satellites orbit Earth approximately every 90 minutes and we cover the entire globe within a month. We’re getting monthly assessments of Earth’s gravity field that tells us what the mass is doing over one month. Through this we can build a time-series.

sea level change
Image Caption

Why do we see changes in Earth’s gravity field? It’s because water is moving from one place to another. As I said with sea level, glaciers are melting, so they are getting lighter; the water from melting glaciers goes into the ocean, so the ocean is getting heavier. When we track these changes over time with satellites, we can see how much the ocean mass is changing and how much the glaciers and ice sheets are decreasing in weight and mass.

By combining our knowledge from the ocean altimetry missions that measure the ocean surface height and the gravity missions that measure the ocean mass we can then distinguish between what is being caused by temperature changes – where the ocean is warming, it is expanding; where the ocean is cooling, it is contracting – and what is being caused by there being more or less water in the ocean, which leads to changes in mass. [For more information about how data from missions like GRACE and GRACE-FO factor into assessments of global mean sea level, please see the Earthdata article The Precision Behind Sea Level Rise.]

Why is it important to have federal agency-supported websites like the NASA Sea Level Change portal?

It’s one thing to go out to sea and collect measurements with a tide gauge, but this doesn’t give you the complete global picture. The satellite missions do this. At NASA we are able to provide a global view of what is going on and we’re able to link what’s going on to the various Earth processes that are directing these actions.

With a website like this, and an [agency] like NASA supporting this website, it gives people access to information that they otherwise would not have. At NASA, we provide all of our data to the public for free; everything is available.

You know, for someone who is not on the computer all the time or who does not know how to write their own code or programs to analyze these data, it can be difficult to interpret what these data mean. This is another area where websites like NASA's Sea Level Change portal come in. It gives people easier access to the data and ways to interpret the data.

The portal has some great information about the Sentinel-6 Michael Freilich mission, which continues the satellite ocean altimetry data record. How are you and your team supporting this mission?

sentinel-6
Image Caption

The Sentinel-6 Michael Freilich mission was developed jointly by ESA (European Space Agency) in the context of the European Copernicus program led by the European Commission, the European Organization for the Exploitation of Meteorological Satellites (EUMETSAT), NASA, and NOAA, with funding support from the European Commission and contributions from the French space agency (CNES). Image: NASA JPL.

We’re all excited about this mission. Certainly, we’re promoting this mission on the portal and keeping people up to date.

Overall, this is a continuation of the altimeter datasets started by TOPEX/Poseidon and the Jason missions. Once data from [Sentinel-6 Michael Freilich] come available we intend to have these data on the portal.

I don’t know how deep you went into the portal, but we have a data analysis tool where we put up ocean altimetry datasets with a global map of the ocean. People can see what the altimetry data look like regionally and globally, and can analyze data through time and compare time-series of different data products. This is where the Sentinel-6 Michael Freilich data eventually will be added. We also have the Global Mean Sea Level Indicator, and this will be continued with the addition of data from this mission.

What are your favorite parts of the portal?

It’s hard to decide! I like to play around with the tools; these are very useful to me as a scientist.

Sometimes I don’t have time to download the data I need; I might have a hunch that something is going on somewhere during a time period. What I used to do is download the data I thought I needed, write my own script to visualize the data, and then analyze the data. I’d spend hours trying to have this one result. With the data tools on the portal, I can quickly look at the data, I can look at a specific region of the ocean and see what’s going on.

There are other tools on the portal that also are very useful. For example, the Flooding Days Projection Tool gives users a sense of what might occur in the future at certain locations. We also have an entire suite of ice sheet simulations where people can play around with seeing, for example, what the effect to Florida could be if the ice sheet melts.

There are many things to discover on the portal. We have some great multi-media pages with really nice infographics and animations. The sea level change indicators are really great. I’m going to these all the time to see at a glance what’s going on globally and to get a quick view of the background.

You’ve been involved with the portal since the beginning. How does it feel to be part of a site that has grown and evolved so much?

When we started the portal, the science communities were still a bit separated. Now, I think we’re seeing that the field is becoming much more interdisciplinary. People have formed these collaborations that weren’t there before. This is enabling us to look at Earth as an interconnected system and how these Earth processes affect sea level. This is a very gratifying thing to see.

Details

Last Updated

Data Center/Project

National Snow and Ice Data Center DAAC (NSIDC DAAC)
Physical Oceanography DAAC (PO.DAAC)