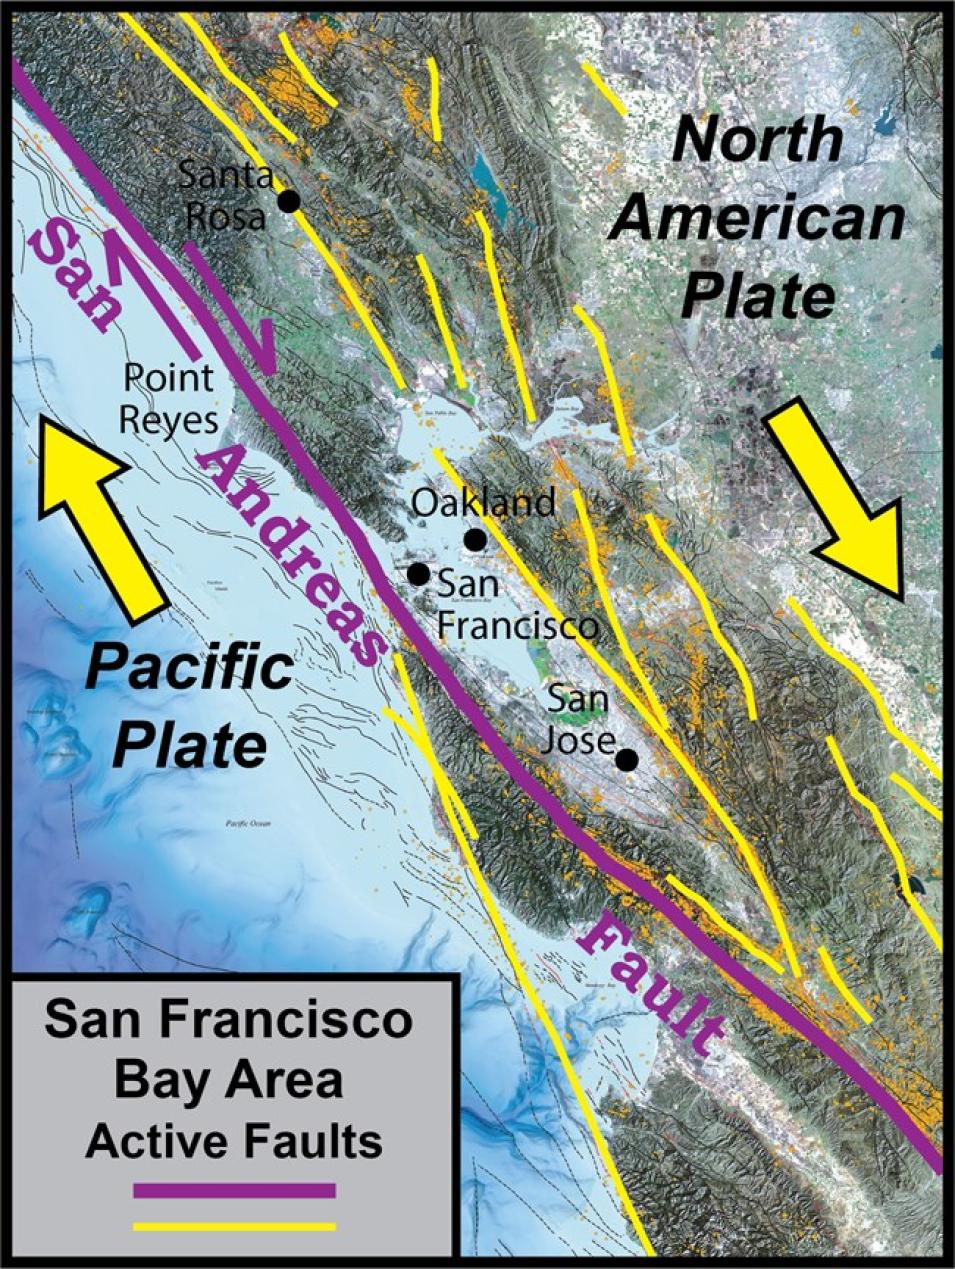
One of Herring’s recent research projects involves analyzing large datasets collected for studying the North America Pacific plate boundary and the deformations happening in North America and the region around it. A well-known part of this region is along the San Andreas Fault, where a section of western California, as part of the Pacific Plate, slides north-northwestward past the rest of North America.
As noted by the USGS, Point Reyes National Seashore, Golden Gate National Recreation Area, and Pinnacles National Park are landscapes shaped by movement of the San Andreas Fault, and Cabrillo National Monument south of San Diego lies within the broad zone of deformation created as the Pacific Plate slides past the North American Plate. GNSS data enable the precise mapping of this deformation as well as the rate of plate movement.
Herring points out that the steady motions at the plate boundaries indicate how strain and stress are accumulating. Transient phenomena, often referred to as slow slip events (SSE), affect the interaction between the stress building at the plate boundary and the release of this stress, which is experienced as an earthquake. The precise relationship between the steady accumulation of stress and the resulting transient phenomena is still being determined, and the ultimate aim of this research is to better understand the processes leading to earthquakes. The GNSS data used in these studies are available through CDDIS along with products generated by the IGS.
GNSS also is useful in studies of how architectural structures, such as tall buildings, radio towers, and similar objects, react to transient phenomena. This is what took Herring to the top of the tallest building in Kuwait – the 1,355-foot Al Hamra Tower. A GPS system was installed near the top of this sinuously curving skyscraper to study the response of the building to earthquakes and environmental changes. In November 2017, the research team used GPS data to analyze the motions at the top of the building due to a distant magnitude 7.3 earthquake.
While motion at ground level was approximately 40 mm, motion at the top of the building was measured at approximately 160 mm. According to the research team, the building responded as expected, although it continued shaking for an extended period of time after the first waves from the earthquake arrived. This research has direct applications for architectural design in earthquake-prone regions and was a collaboration with the Kuwait Institute for Scientific Research (KISR) and the Kuwait Federation for the Advancement of Science (KFAS).
Whether you’re trying to measure the movement of a continental plate moving mere centimeters a year or the rapid deformation to land and structures following an earthquake, a constellation of GNSS satellites traveling tens of thousands of miles per hour around Earth makes this possible. The research of Herring – using data openly available through CDDIS and other sources – is helping make these data even more precise.
Representative data products used or created:
Available through CDDIS:
Products generated by Herring and his colleagues for distribution through CDDIS:
- GPS orbit, clock, and Solution (Software/technique) INdependent EXchange Format (SINEX) files for IGS final GPS orbits from the MIT IGS Analysis Center (AC) doi:10.5067/GNSS/gnss_igsorb_001
- SINEX files with combined IGS analysis centers (Associate Analysis Center, AAC) and regional combined SINEX files (Regional Network Associate Analysis Center, RNAAC); available through the CDDIS GNSS Station Position Products page
Other data products used:
- Interferometric Synthetic Aperture Radar (InSAR) deformation maps; available through NASA's Alaska Satellite Facility DAAC (ASF DAAC)
- Imagery created from data acquired by the Moderate Resolution Imaging Spectroradiometer (MODIS) aboard NASA’s Terra and Aqua satellites; available for interactive exploration using the NASA Worldview data visualization application
- Meteorological products from the Technical University of Vienna; Vienna Mapping Functions (VMF) products doi:10.17616/R3RD2H
- GPS/GNSS RINEX data from multiple archives around the world
Read about the research:
Herring, T.A., Gu, C., Toksöz, M.N., Parol, J., Al-Enezi, A., Al-Jeri, F., Al-Qazweeni, J., Kamal, H. & Büyüköztürk, O. (2018). GPS Measured Response of a Tall Building due to a Distant Mw 7.3 Earthquake. Seismological Research Letters, 90(1): 149-159. doi:10.1785/0220180147
Herring, T.A., Melbourne, T.I, Murray, M.H., Floyd, M.A., Szeliga, W.M., King, R.W., Phillips, D.A., Puskas, C.M., Santillan, M. & Wang, L. (2016). Plate Boundary Observatory and Related Networks: GPS Data Analysis Methods and Geodetic Products. Reviews of Geophysics, 54(4): 759-808. doi:10.1002/2016RG000529
Ji, K.H. & Herring, T.A. (2013). A method for detecting transient signals in GPS position time-series: smoothing and principal component analysis. Geophysical Journal International, 193(1): 171-186. doi:10.1093/gji/ggt003
Ji, K.H. & Herring, T.A. (2012). Correlation between changes in groundwater levels and surface deformation from GPS measurements in the San Gabriel Valley, California. Geophysical Research Letters, 39(1). doi:10.1029/2011GL050195
Explore more Data User Profiles


