Dr. Brian Barnes

Ocean color data provide key information about ocean health. Dr. Barnes uses these data in his investigations into the health of optically shallow waters.

Dr. Brian Barnes, Research Associate, College of Marine Science, University of South Florida, St. Petersburg, FL

Research interests: Using satellite-acquired ocean color data (often combined with in situ data) to assess, monitor, and make inferences about the health of shallow coastal environments, including coral reefs, seagrass beds, and oyster reefs.

Research highlights: Gazing out at the open sea on a calm day, the view often is of a uniform body of water with gently undulating waves. But looks can be deceiving. When it comes to the ocean, what matters most is found under the waves. Revealing the secrets – and the science – under the waves in optically shallow waters is a job perfectly suited for sensors aboard Earth observing satellites.

As noted by Dr. Brian Barnes, optically shallow waters describe locations where the water is clear and shallow enough that the seafloor is detectable to an above-water radiometer (or light sensor). Such sensors can be carried aboard orbiting satellites, mounted aboard aircraft, or even held by scientists. Although optically shallow waters make up only a fraction of the oceans as a whole, a huge portion of the ocean’s productivity and diversity occurs in these regions.

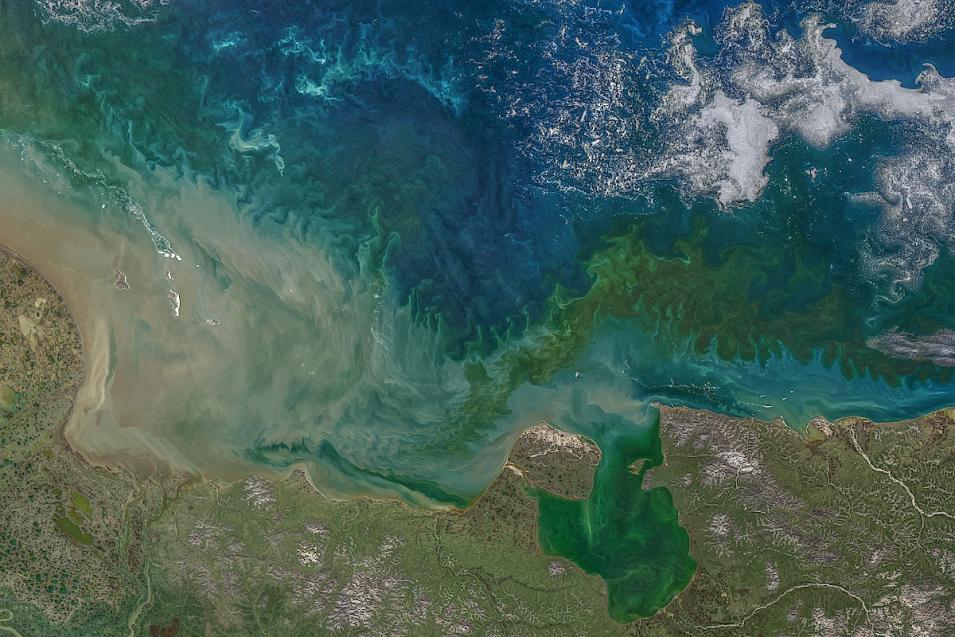
Image of the coast of the East Siberian Sea with swirls of green color mixed in with deep blue water. Areas of brown sediment hug the coast.
Image Caption

The green and blue/green swirls of color in this Aqua/MODIS image of the East Siberian Sea acquired on July 20, 2020, are phytoplankton, suspended sediments, and dissolved organic matter. A warmer than normal summer led to increased phytoplankton abundance, which is clearly seen in this true-color image. Image from the Ocean Color Image Gallery at NASA’s OB.DAAC. https://oceancolor.gsfc.nasa.gov/gallery/712/.

This is because the main driver of ocean primary productivity is sunlight. As on land, the base of the ocean food chain includes organisms that convert sunlight into energy through the process of photosynthesis, such as phytoplankton and macroalgae like Sargassum. When these organisms go through periods of extremely high abundance and productivity (called a bloom), their presence can be detected by sensors and appear as colored areas in satellite imagery. These ocean color data provide important information about ocean health.

Ocean productivity, color, and biology data are an integral part of NASA’s Earth Observing System Data and Information System (EOSDIS) collection. The acquisition, processing, calibration, and validation of these products is done by NASA’s Ocean Biology Processing Group (OBPG), and these products are freely available to scientists like Barnes through NASA's EOSDIS Ocean Biology Distributed Active Archive Center (OB.DAAC).

Barnes uses ocean color data from numerous sensors and missions (many of which are available through OB.DAAC) to investigate shallow coastal environments, such as coral reefs, seagrass beds, and oyster reefs. Interpreting satellite-collected ocean color data, though, is not without difficulty. As Barnes notes, one problem ocean color researchers face is that the energy detected by a satellite sensor includes contributions from the atmosphere, the water column, and even the substrate and organisms living on the ocean floor (an area called the benthic zone, or benthos). By separating these three contributions, researchers can assess water quality in optically shallow waters and the health of benthic environments.

In recent studies, Barnes and his colleagues used a variety of data collection methods to examine the impacts to coral and other aquatic ecosystems from dredging activities at large ports, such as the Port of Miami (which is branded as PortMiami). The dredging of ports to accommodate large ships and keep shipping lanes open creates tremendous disturbances to shallow water ecosystems. This dredging also stirs up sediments that can change the color of areas being dredged, which can be detected by sensors aboard satellites.

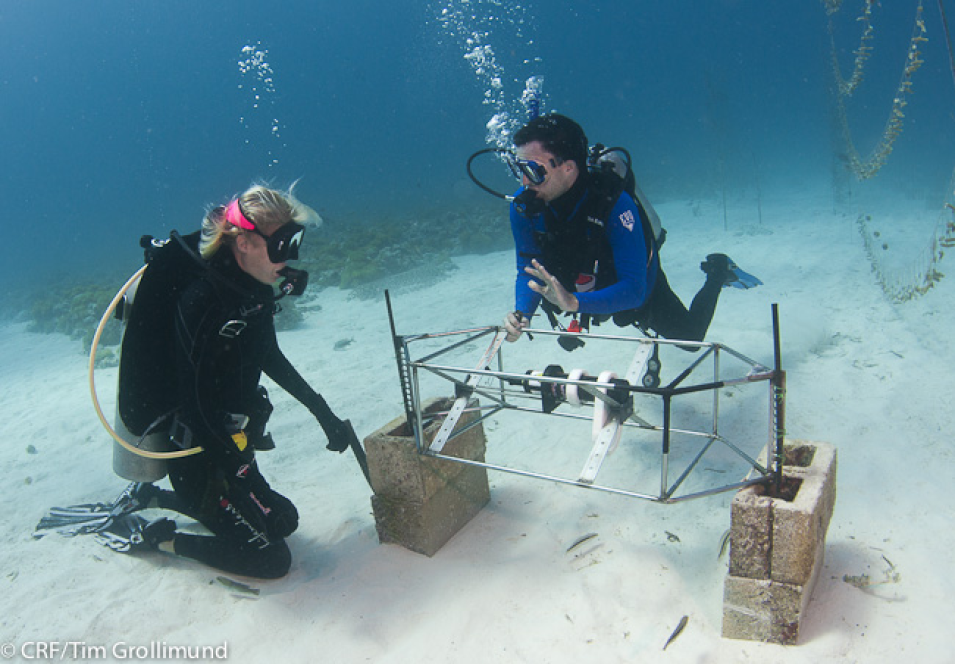
Underwater image of Dr. Barnes and a colleague, both in wetsuits and using SCUBA gear, installing a frame on a sandy shallow-water sea bed.
Image Caption

Barnes (on right) and a colleague install an optical water quality sensor at a coral nursery in the Florida Keys. Along with satellite-acquired data, Barnes uses a variety of field-collected data in his research. Image by Tim Grollimund.

Dredging of PortMaimi in 2013 created large concentrations of suspended sediments in the water column, called turbidity plumes. Since these plumes could be observed in the satellite data record, Barnes and his colleagues developed methods to quantify these plumes as they developed over time. The research team coupled these analyses with historical data collected from in situ sensors, such as National Data Buoy Center (NDBC) buoys in and around PortMiami. Since turbidity plumes naturally occur in most coastal systems (strong winds, for example, can stir-up and suspend sediments), the combination of satellite imagery with in situ buoy data enabled the team to quantify the size and frequency of plumes that were beyond what would be expected to naturally occur in and around PortMiami.

The team also used a combination of satellite ocean color data and in situ measurements to examine the impact to several threatened species of coral in reefs near PortMiami. Coupling satellite-collected data with physical measurements of coral burial and other criteria during the dredging, Barnes was able to identify huge areas of reef that were impacted – potentially to the point of coral mortality. Stemming from this work, the U.S. Environmental Protection Agency (EPA) asked the research team to establish satellite-derived baseline turbidity conditions for an upcoming dredging project north of PortMiami. This baseline can be used for near real-time monitoring of anomalies resulting from the dredging. Barnes and his colleagues also used similar methods in a 2016 study examining impacts from island building activities in the South China Sea.

In a larger research project, Barnes is part of a team exploring changes in the abundance and distribution of a floating macroalgae called Sargassum in the central Atlantic Ocean (doi:10.1126/science.aaw7912). Sargassum naturally occurs in the Central Atlantic, where it forms floating mats large enough to be detected in satellite imagery. Many ocean species rely on these floating mats for shelter, food, nursery areas, breeding grounds, and other basic functions. When Sargassum blooms collect near or onshore, however, they can have ecologic and economic consequences. Ecologically, Sargassum blooms can smother benthic environments; economically, the blooms can impact tourism as they rot and emit a foul odor, and can be expensive to remove from beaches and other public areas.

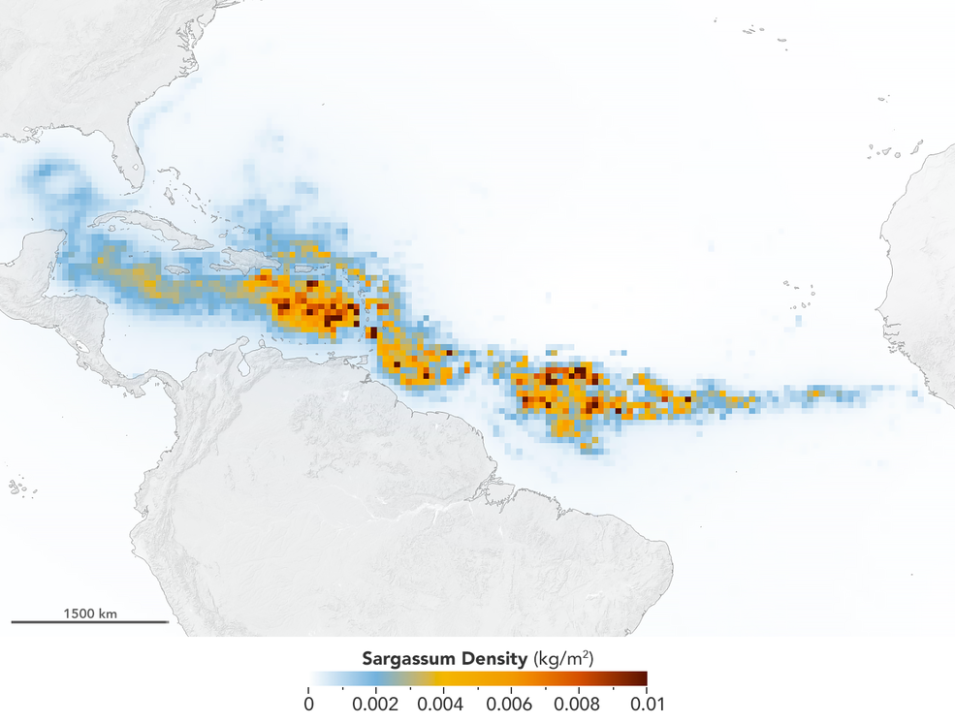
Map of the Caribbean, the Gulf of Mexico, and the western Atlantic Ocean with a crescent-shaped blue arc extending from the Gulf out into the Atlantic Ocean indicating the GASB. Yellow/red areas in the blue crescent indicate areas of high Sargassum concentrations.
Image Caption

The GASB in July 2018. Barnes was part of the team that used data acquired by the MODIS instrument aboard NASA’s Aqua satellite to discover the GASB. With the exception of 2013, the GASB has formed every year since 2011, and often stretches from the west coast of Africa to the Gulf of Mexico. Click on image for larger view. Credit: NASA/Earth Observatory and based on data provided by Mengqiu Wang and Chuanmin Hu, USF College of Marine Science.

Since 2011, a Great Atlantic Sargassum Belt (GASB) has been observed in satellite imagery. These recurring huge blooms of Sargassum cover an area that can stretch almost 9,000 km (almost 5,600 miles). Led by Dr. Mengqiu Wang at the University of South Florida (USF), Barnes has been heavily involved in a team working to predict the movement of the GASB and its potential to impact shorelines.

An important resource in this work is the almost 20-year record of daily global imagery acquired by the Moderate Resolution Imaging Spectroradiometer (MODIS) instrument aboard NASA’s Aqua satellite (launched in 2002). The daily MODIS imagery enabled the team to not only track the movement of the GASB, but also its origins. Combining MODIS imagery with sea surface temperature (SST) data, the team found that recent bloom events show connections to nutrient enrichment and climatic variations. Remotely sensed data also enabled the team to determine that one source of nutrient enrichment in the central west Atlantic Ocean was increased deforestation and fertilizer use in Brazil. These activities have increased the amount of nitrogen in the water column, stimulating Sargassum blooms.

While much of Barnes’ work utilizes Aqua/MODIS data and imagery, this instrument has been in orbit since 2002 and already has far exceeded its predicted life span. Fortunately, MODIS is not the only orbiting sensor collecting ocean color data. The Visible Infrared Imaging Radiometer Suite (VIIRS) aboard the joint NASA/NOAA Suomi National Polar-orbiting Partnership (Suomi NPP; launched in 2011) and NOAA-20 (launched in 2017) satellites, the Ocean and Land Colour Instrument (OLCI) aboard the European Space Agency (ESA) Sentinel-3 A and B satellites (launched in 2016 and 2018, respectively), and NASA’s Sea-viewing Wide Field-of-view Sensor (SeaWiFS) aboard the SeaStar satellite (operational 1997 to 2010) all provide(d) valuable ocean color data.

Barnes is part of the team developing applications for the next generation of ocean color sensors: the Ocean Color Instrument (OCI). The OCI is the primary sensor aboard NASA’s Plankton, Aerosol, Cloud, ocean Ecosystem (PACE) satellite, which is scheduled for launch in 2022. The OCI will be the most advanced ocean color sensor ever launched by NASA. What sets the OCI apart from other ocean color sensors is that it will detect radiation along a very broad spectrum of wavelengths at 5 nanometer (nm) intervals, including the ultraviolet (UV) (350-400 nm), visible (400-700 nm), and near infrared (700-885 nm), as well as several shortwave infrared bands. While heritage sensors are multi-spectral (collecting measurements at a few discrete wavelengths), OCI is hyperspectral, and collects continuous measurements across the visible light spectrum. As PACE Project Scientist Dr. Jeremy Werdell observes, heritage sensors are like a crayon box with eight colors; OCI is the 64-crayon box that we all wanted as kids. The result will be a sensor providing an unprecedented view of the ocean without the sensor wavelength blind spots of previous satellite-borne sensors.

Thanks to the next generation of ocean color sensors, we are on the verge of a new era of investigation in exploring ocean science. Through the work of scientists like Barnes, these data and discoveries soon will be part of NASA’s ever-growing EOSDIS collection.

Representative data products used; available through NASA’s OB.DAAC:

Read about the research:

Barnes, B.B., Hu, C., Bailey, S.W. & Franz, B.A. (2020). Sensitivity of Satellite Ocean Color Data to System Vicarious Calibration of the Long Near Infrared Band. IEEE Transactions on Geoscience and Remote Sensing. doi:10.1109/tgrs.2020.3000475

Gray, E. (2019). NASA Satellites Find Biggest Seaweed Bloom in the World. NASA’s Earth Science News Team. Published July 8, 2019. Available online (link).

Wang, M., Hu, C., Barnes, B.B., Mitchum, G. & Lapointe, B. (2019). The Great Atlantic Sargassum Belt. Science, 365(6448): 83-87. doi:10.1126/science.aaw7912

Cunning, R., Silverstein, R.N., Barnes, B.B. & Baker, A.C. (2019). Extensive coral mortality and critical habitat loss following dredging associated with remotely-sensed sediment plumes. Marine Pollution Bulletin, 145: 185-199. doi:10.1016/j.marpolbul.2019.05.027

Explore more Data User Profiles
Details

Last Updated

Data Center/Project

Ocean Biology DAAC (OB.DAAC)