Since 2004, NASA’s My NASA Data initiative has provided resources to students and teachers in grades 3-12 to introduce Earth science data from NASA and other space agencies and help students learn how to work with and analyze these resources. The Earth System Data Explorer (ESDE) is the Earth science data visualization tool created by the My NASA Data team to enable simple, rapid access and visualization of more than 60 datasets that supplement My NASA Data teaching curricula.
New Features Added to the Earth System Data Explorer
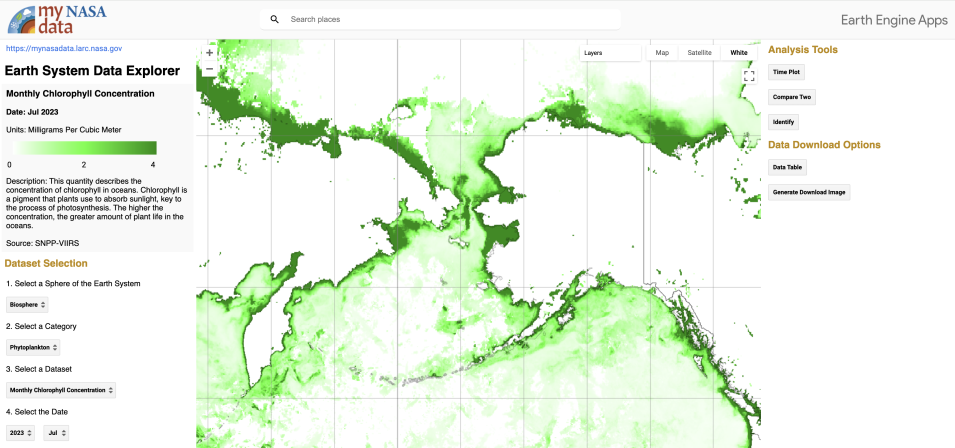
Data visualization from the Earth System Data Explorer showing monthly chlorophyll concentrations off Alaska and Russia for July 2023, with darker green indicating higher concentrations. The data were acquired by the Visible Infrared Imaging Radiometer Suite (VIIRS) instrument aboard the joint NASA/NOAA Suomi National Polar-orbiting Partnership (Suomi NPP) platform. Credit: My NASA Data.
Version 2 of the ESDE uses the Google Earth Engine platform as a base. Data products are organized by Earth system sphere (Atmosphere, Biosphere, Cryosphere, Geosphere, Hydrosphere, and Earth as a System) as well as the organization of data by specific phenomena. Clicking on a dataset name takes users to a description of the variable, the units in which the variable is being measured, and the NASA (or other) platform from which the data were collected.
New analysis tools such as the Line Plot tool allows students to directly probe data about location/time of interest, and the new Compare Two tool allows students to analyze how the scientific variables relate to one another. For example, students can investigate extreme heat by comparing maps of surface temperature to vegetation cover.
