VEDA (Visualization, Exploration, and Data Analysis) is an innovative platform empowering researchers to explore and analyze Earth science data in the cloud. By combining interactive storytelling with open science principles, VEDA enables researchers to engage new audiences and share their analysis results effectively. Developed through a collaboration between NASA IMPACT, Development Seed, University of Alabama in Huntsville, Element 84, Indiana University, International Interactive Computing Collaboration (2i2c), Earth Science Data and Information System (ESDIS) Project, NASA Science Managed Cloud Environment (SMCE), and NASA Mission Cloud Platform (MCP), VEDA significantly reduces the barriers to accessing Earth science data and the computational resources needed for exploring and processing the petabyte-scale Earth data archives in the cloud. VEDA’s achievement exemplifies the core principles of NASA’s Open-Source Science Initiative (OSSI), showcasing commitment to promoting transparent, accessible, and collaborative scientific research.
Introducing VEDA: An Open Science Platform to Accelerate Earth Science Research and Application
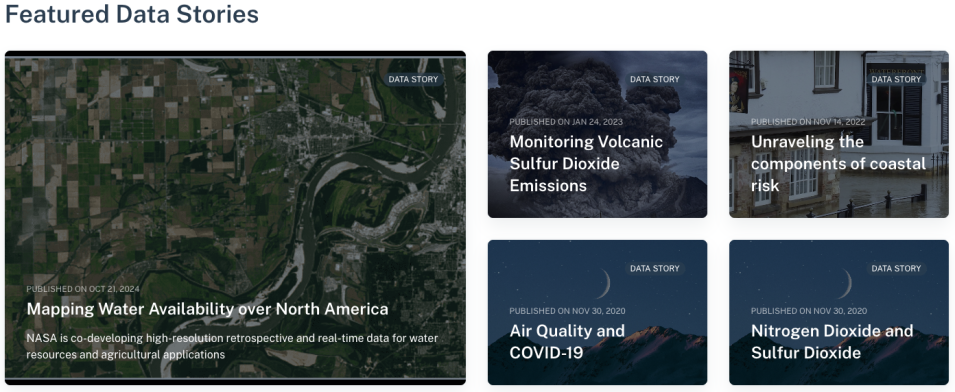
Interpreting Earth science results can often be challenging without visuals. Interactive data presentation plays a key role in fostering engagement and facilitating comprehension. By incorporating interactive maps and expert narratives, complex information is transformed into engaging stories that attract a wide range of readers, from scientists to enthusiasts with limited scientific knowledge. Presenting complicated scientific concepts in a way that engages the general population is one main purpose of the VEDA Dashboard, the visualization and exploration component of the VEDA platform.
In the spring of 2020, as the COVID-19 pandemic gripped the world, the foundation for the VEDA Dashboard was laid. With much of the world’s population encouraged to stay home, researchers noticed new and interesting changes in the global environment. Earth-observing satellites, instruments aboard the International Space Station, airborne campaigns, and ground observations monitored changes in carbon dioxide, water quality, nighttime lights, agriculture, and nitrogen dioxide. To convey the changes observed, a trilateral effort with NASA, the European Space Agency (ESA), and the Japan Aerospace Exploration Agency (JAXA) was spawned to develop the Earth Observing (EO) Dashboard — a successful display of how collaboration between agencies can advance science for all. At the same time, NASA created the COVID-19 Dashboard, which provides public access to observations made using Earth observation satellite data. The dashboard illustrates changes in the global environment and socio-economic activities before and after the pandemic.
Inspired by the COVID-19 Dashboard, VEDA was officially launched in the spring of 2022, expanding the exploration and data analysis capabilities. “The VEDA Dashboard’s datasets and stores are configured via VEDA’s core SpatioTemporal Asset Catalog (STAC). Scientists configure scrollytelling stories with interactive maps and text without writing code,” shares Aimee Barciauskas, Development Seed Data Engineer and technical consultant on the VEDA IMPACT Team. The trilateral EO Dashboard utilizes NASA data directly from the VEDA platform, reducing redundancy and making future updates easier.
Flexible and extensible data services are important for serving the analytics platform in VEDA. The analytics platform is a collaborative computing environment for science researchers to explore NASA Earth science data and data contributed by scientists leveraging the VEDA platform. The Earth Information Systems (EIS) science teams work with VEDA developers to expand the scale of their science. For example, VEDA and EIS teams scaled the EIS active fire monitoring and predictions from California to the continental U.S. and automated monitoring to run every 12 hours.
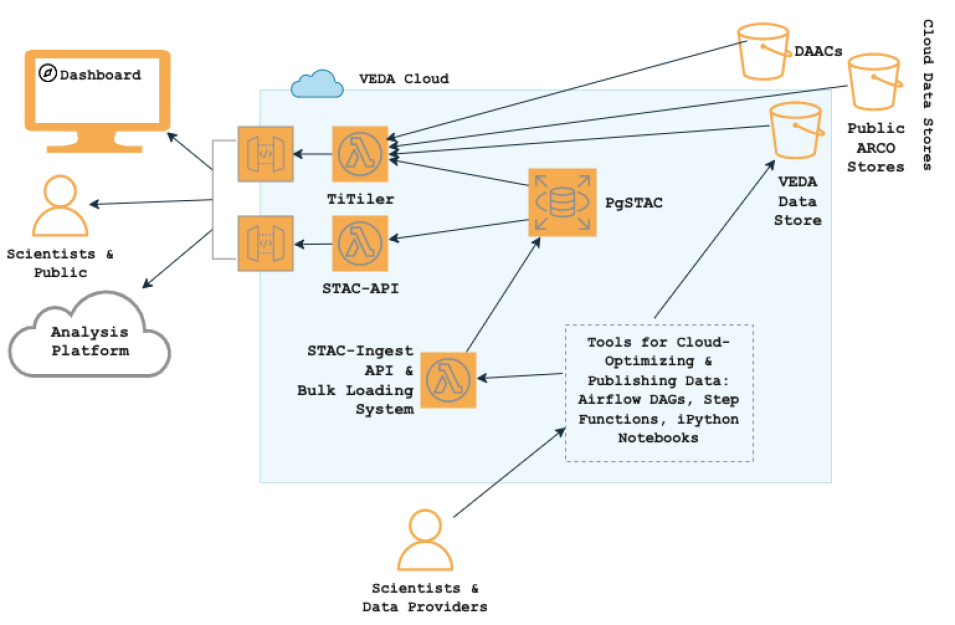
VEDA’s configurable and reusable cloud infrastructure packages are built entirely from open-source software. This component diagram shows VEDA’s core implementation, which includes a central publication database serving APIs for search and discovery and tiling tools for web dashboards and hosted analysis hubs.
In addition to its technical advancements, VEDA is actively fostering a self-supporting community centered around the platform. This community harmonizes efforts with the Multi-Mission Algorithm and Analysis Platform (MAAP) and the U.S. Greenhouse Gas Monitoring Center, ensuring seamless coordination and synergy. “Recently, the VEDA platform was used to conduct an IEEE-led summer school session on data science. To promote knowledge sharing and best practices, future plans include hosting focused workshops, aligning with the Transform to Open Science (TOPS) initiative,” says Dr. Manil Maskey, the visionary behind the VEDA platform. Moreover, a VEDA community forum will be established to facilitate the exchange of ideas and expertise on interoperability, open-source software, and cloud-native services both within and outside of NASA.
The latest initiative to leverage VEDA is the U.S. Greenhouse Gas (GHG) Monitoring Center data and information system, scheduled for launch later this summer in 2023. By utilizing VEDA’s existing framework, developers can rapidly and efficiently construct the new site without starting from scratch. This approach streamlines the development process and ensures a seamless transition. The U.S. GHG Center is a collaborative effort between four agencies, namely NASA (National Aeronautics and Space Administration), EPA (the Environmental Protection Agency), NOAA (National Oceanic and Atmospheric Administration), and NIST (National Institute of Standards and Technology). With the potential to incorporate contributions from additional agencies, state governments, and non-public organizations, the U.S. GHG Center underscores the importance of collaboration and data-driven solutions in addressing greenhouse gas monitoring challenges.
The VEDA platform is more than a way to visualize data. It is a robust open-data ecosystem of data, tools, storytelling, and analysis. As the VEDA platform continues to grow and thrive, it exemplifies the power of collaborative platforms in advancing scientific understanding and informed decision-making. We are excited to showcase VEDA at several conferences this year, including IGARSS and AGU. To learn more, check out the VEDA dashboard, the public GitHub repositories, or catch up at a conference.
See the Trilateral EO dashboard. Check out the GitHub wiki.
More information about IMPACT can be found at NASA Earthdata and the IMPACT project website.

