Embeddable Worldview, Historical Events, and GeoColor

Worldview's latest release, v3.11.0, contains a few new features and imagery layers that we'd like to share with you!

New Features

Embedded Worldview

Learn how to embed NASA Worldview into a web page, StoryMap, or other web-based product, by following the steps outlined on the Create an embedded Worldview page. Compared to the full application, the embedded version of Worldview has intentionally limited functionality to give users a more streamlined experience.

Learn more: Worldview’s New Embed Feature Makes Telling Data-Driven Stories Easier than Ever. Also, check out the Worldview embed examples page to see how you might embed Worldview onto your own web page.

Example comparing imagery from different dates

The Bootleg Fire in Oregon was detected on 6 July 2021 and initiated by a lightning strike but propelled by hot, dry and windy weather. The false color (Bands 7-2-1) Corrected Reflectance images from the Moderate Resolution Imaging Spectroradiometer (MODIS) aboard the Aqua satellite below show the area burned between 9 July and 18 July. Burned areas or fire-affected areas are characterized by deposits of charcoal and ash, removal of vegetation and/or the alteration of vegetation structure. When bare soil becomes exposed, the brightness in Band 1 may increase, but that may be offset by the presence of black carbon residue; the near infrared (Band 2) will become darker, and Band 7 becomes more reflective. When assigned to red in the image, Band 7 will show burn scars as deep or bright red, depending on the type of vegetation burned, the amount of residue, or the completeness of the burn.

The left "A" side of the map shows the burned area on 9 July and the right "B" side shows the burned area on 18 July. Swipe back and forth to see how much the burned area grew in 9 days. The imagery also shows the active fire front in bright red with smoke emanating from it.

Sources: InciWeb - Bootleg Fire
Historical Events

Worldview now provides access to the entire curated list of archived events from the NASA Earth Observatory Natural Event Tracker (EONET).

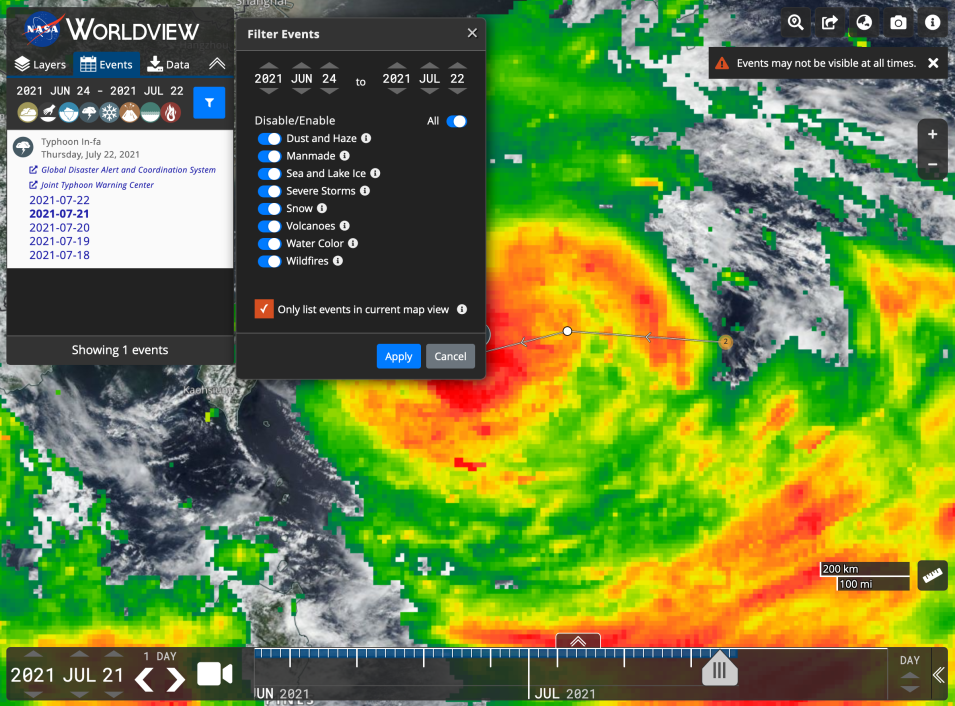
Click on the "Events" tab in the sidebar and you will be presented with the first 50 events from the past few months. Just click on the blue filter icon to start narrowing down the events. You can filter events by date, event type, and events in the current map view. Events go back to 1 January 2000, though not all event types/categories have events populated back to 1 January 2000. Event types include Dust and Haze, Manmade, Sea and Lake Ice, Severe Storms, Snow, Volcanoes, Water Color and Wildfires. You can also check the box to "Only list events in current map view" to further filter your search results.

Screenshot of the events tab and event filter options in Worldview superimposed over a satellite image of a typhoon.
Image Caption

Screenshot of the Events tab and event filter options. https://go.nasa.gov/3iHrvNn

New Imagery Layers

GeoColor, GOES-East and GOES-West

Worldview has added GeoColor imagery from the geostationary satellites, GOES-East and GOES-West, along with the existing Red Visible, Clean Infrared and Air Mass layers.

All geostationary imagery are available in Worldview on a rolling 90-day window.

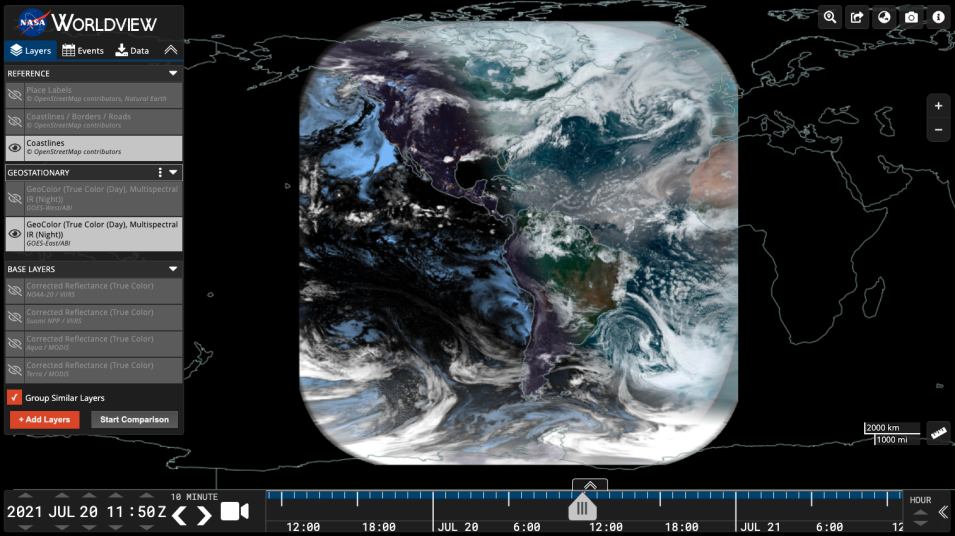
The GeoColor (True Color (Day), Multispectral blended infrared (IR; at Night)) layer from the GOES-East and GOES-West Advanced Baseline Imager (ABI) provides an approximation to daytime True Color imagery. The combination of spectral bands yields an appearance similar to what the human eye would perceive for land surface, oceanic and atmospheric features, with atmospheric correction used to make the appearance of these features sharper. Thus it is used primarily for the intuitive interpretation of meteorological and surface-based features such as smoke, blowing dust, and vegetation types (forests, deserts, croplands, etc.). At night, the true color imagery gives way to IR-based blended multispectral imagery that provides differentiation between low liquid water clouds (shown in light-blue) and higher ice clouds (shown in gray/white). It also includes a static city lights/night lights database derived from the VIIRS Day/Night Band, which aids in geo-referencing and can help determine the proximity of clouds (such as fog) or weather hazards (such as thunderstorms or tropical cyclones) to population centers. Please note that as these lights are static, they will not change even if, for example, a weather-induced power outage occurs.

Learn more: NASA Worldview Adds GeoColor Imagery from the joint NASA/NOAA GOES-East and GOES-West Satellites.

Screenshot of Worldview showing GeoColor imagery applied to a satellite image of North and South America, with swirling white clouds above blue ocean and green-brown land.
Image Caption

Screenshot of GeoColor from ABI aboard the GOES-East satellite on 20 July 2021 at 11:50Z. https://go.nasa.gov/3eJNvWu

Wind Speed (CDR, Daily), CYGNSS/DDMI

The CYGNSS/DDMI Level 3 Wind Speed (CDR, Daily) layer is the daily ocean surface wind speed in meters per second (m/s) as provided by the Delay Doppler Mapping Instrument (DDMI) on board the CYGNSS spacecraft constellation. The layer provides high resolution wind speed data that allows for global tropical ocean observation. The primary mission objective for CYGNSS is to provide frequent space‐based measurements of ocean surface wind speed in the inner core of tropical cyclones. The orbital asynchronicity with respect to the local solar daytime/nighttime patterns may provide additional scientific opportunity to study wind speed variations and patterns due to the diurnal cycle. The data imagery is provided by the CYGNSS Version 1.0 CYGNSS Level 3 Climate Data Record (CDR). The Version 1.0 CDR represents the first climate-quality release and is a collection of reanalysis products derived from the Science Data Record v2.1 Level 1 data.

Sea Surface Height Anomalies (GDR Cycles), TOPEX/POSEIDON, JASON-1, OSTM/Jason-2, and Jason-3

The Sea Surface Height Anomalies (GDR Cycles) layer displays along track Sea Surface Height Anomalies (SSHA) for individual 10-day cycles from the TOPEX/Poseidon, Jason-1, OSTM/Jason-2, and Jason-3 missions geo-referenced to a mean reference orbit.

Deep Blue Aerosol Type, Suomi NPP / VIIRS

The VIIRS Deep Blue Aerosol Type layer provides information related to the aerosol composition over land and ocean. Types include Dust, Smoke, High Altitude Smoke, Pyrocumulonimbus Clouds, Non-Smoke Fine Mode, Mixed, Background and Fine Dominated.

The Deep Blue (DB) algorithm is employed for over-land use and the Satellite Ocean Aerosol Retrieval (SOAR) algorithm is used over water to determine atmospheric aerosol type for day time cloud-free snow-free scenes. The combined Aerosol Type over land and ocean layer is derived from pixels that pass high-quality assurance tests. Over water, aerosol type is retrieved via the aerosol type optical model that yields the best fit. Over land, aerosol type is classified based on Aerosol Optical Depth (AOD), Ångström exponent, Lambert Equivalent Reflectivity (LER), and brightness temperature.

Land Surface Temperature, MODIS/Aqua | Terra/ASTER

The Land Surface Temperature (Day | Night) layers are from the new Land Surface Temperature and Emissivity (LST&E) product (MOD/MYD21), which is in addition to the heritage MOD11/MYD11 Land Surface Temperature (LST) product. These layers show the temperature of the land surface in Kelvin (K).

Black Sky Albedo, MODIS/Terra and Aqua

The Black Sky Albedo (L3, Daily) layer is created from the Moderate Resolution Imaging Spectroradiometer (MODIS) MCD43A3 Albedo Model dataset is produced daily using 16 days of Terra and Aqua MODIS data at 500 meter (m) resolution. Data are temporally weighted to the ninth day of the 16 day.

The MCD43A3 provides black-sky albedo (directional hemispherical reflectance) and white-sky albedo (bihemispherical reflectance) data at local solar noon.

Screenshot of Worldview showing the Aerosol Type layer superimposed above a satellite image of Earth with areas of red and green indicating aerosol concentrations.
Image Caption

Screenshot of Aerosol Type from VIIRS aboard the joint NASA/NOAA Suomi NPP satellite on 20 July 2021. https://go.nasa.gov/3By9wl2

Updated and Removed Layers

  • All MODIS Land NRT and STD layers are in the process of being updated to collection 6.1. It will currently be a mix of v6.0 and 6.1.
  • Snow Water Equivalent, AMSR-2 (Daily, 5-Day, Monthly) have been updated to v2 for NRT and vB02 for STD.
  • Deep Blue Aerosol Optical Thickness and Aerosol Angstrom Exponent from Suomi NPP/VIIRS have been updated to v1.1.
  • G1SST Sea Surface Temperature from GHRSST has been retired.
  • Cloud Liquid Water, Columnar Water Vapor, Surface Precipitation Rate, Rain Rate and Wind Speed from AMSR-2 (Rain Ocean Products) have been retired.

Details

Last Updated

Published