Dr. Navin Ramankutty, Professor in the School of Public Policy and Global Affairs and the Institute for Resources, Environment, and Sustainability, University of British Columbia, Vancouver, British Columbia, Canada
Research interests: Ramankutty uses Earth observing data and models as part of his research into the global patterns and intensity of agricultural land use and the environmental impacts of these actions.
Research highlights: You likely will never encounter a Schomburgk’s deer (Rucervus schomburgki) in Thailand. Nor will you stumble over a sprig of St. Helena olive (Nesiota elliptica) on the island of Saint Helena. These extinct species are among the more than 100 species on the International Union for Conservation of Nature and Natural Resources Red List of Threatened Species whose extinction is attributed to impacts from the conversion of natural areas into agricultural and grazing land. As Dr. Navin Ramankutty and his colleagues point out, the terrestrial biosphere made the critical transition from being mostly wild and natural to being mostly altered by human influence (anthropogenic) early in the 20th century, when the proportion of anthropogenic areas to natural land passed the 50 percent mark. And this use has consequences.

In his more than 20 years studying sustainable land and food systems and changes in land use over time, Ramankutty notes that human clearing of land for agriculture along with the intensification of agricultural production through the use of irrigation, fertilizers, pesticides, and other means has led to significant local and global environmental impacts. Recent data from the World Bank indicate that agriculture, forestry, and land use change are responsible for 25 percent of global greenhouse gas emissions and 70 percent of global water use; data from the USDA Economic Research Service (USDA ERS) show that agricultural practices were responsible for 10.5 percent of 2018 U.S. greenhouse gas emissions.
Agriculture, however, also has significant social and economic benefits. It is one of the most powerful tools for ending extreme poverty, according to the World Bank, with growth in the agricultural sector being two to four times more effective for raising incomes than other economic sectors. In the U.S., agricultural production from farms contributed $138.2 billion to the U.S. Gross Domestic Product (GDP) in 2017, according to the USDA ERS, and employment in agriculture, food, and related industries accounted for 22 million jobs (11 percent of U.S. employment) in 2018.
Balancing the economic and food provision benefits of agriculture with the environmental impacts of current agricultural practices (such as intensive use of fertilizers and irrigation) is where Ramankutty comes in. His work and research aim to mitigate the environmental impacts of agriculture, and he observes that this will take a combination of strategies. Some strategies he proposes for creating more sustainable agricultural practices include halting deforestation for non-food crop production, more efficient use of water and nutrients, shifting to more plant-based diets, and reducing food waste.
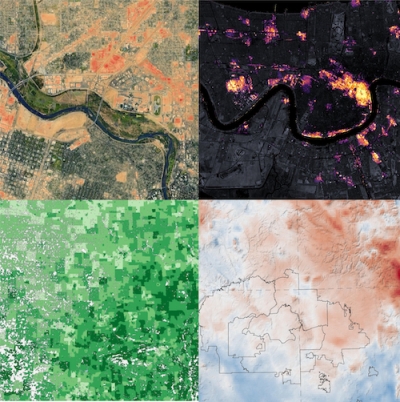
Data for evaluating these strategies and determining their potential are available through many sources. While agricultural metrics about crop production, water allocation, and energy use are maintained by governmental entities like the USDA and the European Commission, remotely sensed data from Earth observing satellites – data freely available through NASA’s Earth Observing System Data and Information System (EOSDIS) – also provide vital information. More than 20 years of daily global imagery from the Moderate Resolution Imaging Spectroradiometer (MODIS) instruments aboard NASA’s Terra and Aqua satellites, for example, provide the temporal and spatial coverage needed to study land-use change over time, such as the transformation of remote areas into cropland.

Along with using remotely-sensed data in his research, Ramankutty also uses these data as inputs into datasets that are distributed by NASA’s Socioeconomic Data and Applications Center (SEDAC). Hosted at Columbia University’s Center for International Earth Science Information Network (CIESIN), SEDAC is the EOSDIS Distributed Active Archive Center (DAAC) responsible for archiving and distributing socioeconomic data in the EOSDIS collection, and serves as an “Information Gateway” between the socioeconomic and Earth science data and information domains.
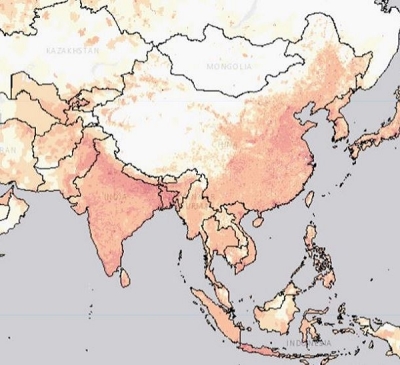
Ramankutty and his colleagues pioneered an innovative statistical data fusion technique for merging satellite‐derived land cover datasets (such as MODIS land cover data) with ground‐based national and subnational cropland inventory statistics (such as census data and agricultural statistics) to develop maps of Earth’s cropland and pastures. These were later combined with global population density data to show historical anthropogenic changes to discrete global environmental communities (biomes). Available through SEDAC, the Anthropogenic Biomes data collection comprises five datasets and 35 maps describing globally-significant ecological patterns within the terrestrial biosphere caused by sustained direct human interaction with ecosystems through activities including agriculture, urbanization, forestry, and other land uses.

The Anthropogenic Biomes of the World, Version 1 (2001 to 2006) dataset (doi:10.7927/H4H12ZXD) delineates discrete anthropogenic biomes based on population density, land use, and vegetation cover, with anthropogenic biomes grouped into six major categories – dense settlements, villages, croplands, rangeland, forested, and wildlands. Anthropogenic Biomes Version 2 comprises four datasets providing information on anthropogenic transformation of the biosphere from 1700 to 2000. As noted by the research team, these datasets have been widely used by the global change community and have been employed in studies including investigations into regional food security, assessments of global regions undergoing rapid land cover change, global carbon cycle modeling and the role of agriculture in carbon cycling, and estimates of global soil erosion.
In recent research, Ramankutty explored the potential costs of an intriguing proposal to re-allocate half of Earth’s surface back to nature. As advocated by the Half-Earth Project, among other groups, re-allocating half of Earth’s surface from uses such as farming or grazing to protected habitat could enable as much as 85 percent of Earth’s known species to survive sustainably, according to figures provided by the Half-Earth Project. While noting that this proposal “is a powerful message that could motivate and empower the public and local organizations to take positive action to protect the biosphere at the level needed to reduce biodiversity decline,” the research team also observes that the impacts of this proposal on disadvantaged populations around the world, especially in terms of agricultural and food-production trade-offs, are poorly understood.
An analysis by Ramankutty and his colleagues incorporating MODIS land cover data with data including calorie production for the world’s 41 major crop plants, protected areas, key biodiversity areas, ecoregion boundaries, country boundaries, and potential natural vegetation, shows that implementing a Half-Earth-type proposal could have significant consequences, especially in the developing world. Along with the practical challenges of implementing such a strategy among a multitude of intergovernmental bodies and the fact that agriculture would become even more intense in the remaining 50 percent of Earth’s terrestrial surface, the research team found that a Half-Earth strategy could result in the global loss of 15 to 31 percent of cropland, 10 to 45 percent of pastureland, 23 to 25 percent of non-food calories, and 3 to 29 percent of food calories from crops. As the team summarizes, “we find no clear pathway to give half our planet to nature at a scale that maintains ecosystem connectivity and still feeds the world, without at least some nations or sub-populations losing out.”
Ramankutty observes that instead of looking for a single best solution, identifying pathways for transformation within specific farming systems may best lead us toward more sustainable agricultural practices. A fusion of satellite-acquired Earth observing data, agricultural statistics, and environmental data is enabling Ramankutty to identify these pathways and helping him find strategies to ensure the right balance between land use and environmental protection.
Representative data products co-created or used:
- Datasets available through SEDAC:
- Global Agricultural Lands Data Collection (Ramankutty is primary author):
- Croplands, v1 (2000) (doi:10.7927/H4C8276G)
- Pastures, v1 (2000) (doi:10.7927/H47H1GGR)
- Global Agricultural Inputs Data Collection (Ramankutty is co-author):
- Nitrogen Fertilizer Application, v1 (1994 to 2001) (doi:10.7927/H4Q81B0R)
- Nitrogen in Manure Production, v1 (1994 to 2001) (doi:10.7927/H4KH0K81)
- Phosphorus Fertilizer Application, v1 (1994 to 2001) (doi:10.7927/H4FQ9TJR)
- Phosphorus in Manure Production, v1 (1994 to 2001) (doi:10.7927/H49Z92TD)
- Anthropogenic Biomes Data Collection (Ramankutty is co-author):
- Anthropogenic Biomes of the World, v1 (doi:10.7927/H4H12ZXD)
- Anthropogenic Biomes of the World, v2 (1700) (doi:10.7927/H4SF2T3M)
- Anthropogenic Biomes of the World, v2 (1800) (doi:10.7927/H4NP22C8)
- Anthropogenic Biomes of the World, v2 (1900) (doi:10.7927/H4J1012K)
- Anthropogenic Biomes of the World, v2 (2000) (doi:10.7927/H4D798B9)
- Global Agricultural Lands Data Collection (Ramankutty is primary author):
- MODIS/Terra and Aqua Land Cover Type Yearly L3 Global (MCD12Q1; doi:10.5067/MODIS/MCD12Q1.006); available through NASA’s Land Processes DAAC (LP DAAC)
Read about the research:
Mehrabi, Z., Ellis, E.C. & Ramankutty, N. (2018). The challenge of feeding the world while conserving half the planet. Nature Sustainability, 1: 409-412. doi:10.1038/s41893-018-0119-8
Ricciardi, V., Ramankutty, N., Mehrabi, Z., Jarvis, L. & Chookolingo, B. (2018). How much of the world’s food do smallholders produce? Global Food Security, 17: 64-72. doi:10.1016/j.gfs.2018.05.002
Ramankutty, N., Evan, A.T., Monfreda, C. & Foley, J.A. (2008). Farming the Planet: 1. Geographic Distribution of Global Agricultural Lands in the Year 2000. Global Biogeochemical Cycles, 22(1). doi:10.1029/2007GB002952