The Case of the Missing Waves

Earth’s atmosphere works in mysterious ways.
author-share

Decked out in a white spacesuit, Alan Eustace, a space diver and former Google executive, jumped from a perfectly good balloon in 2014, setting a record free fall speed of 1,321 kilometers per hour (821 miles per hour). The balloon had carried him more than 25 miles above Earth into the stratosphere, where commercial jets fly and the air is too thin to breathe.

Yet amazing things happen in the stratosphere every day—things we cannot see, like massive, invisible waves. These atmospheric phenomena, called gravity waves, have piqued the interest of Corwin Wright, a researcher at the University of Bath. Like ocean waves, gravity waves can travel for thousands of miles, building tremendous momentum and power along the way. Wright wanted to better understand them and their behavior to improve the models that predict weather and climate. But those models have not been able to fully see them, until now.

Image
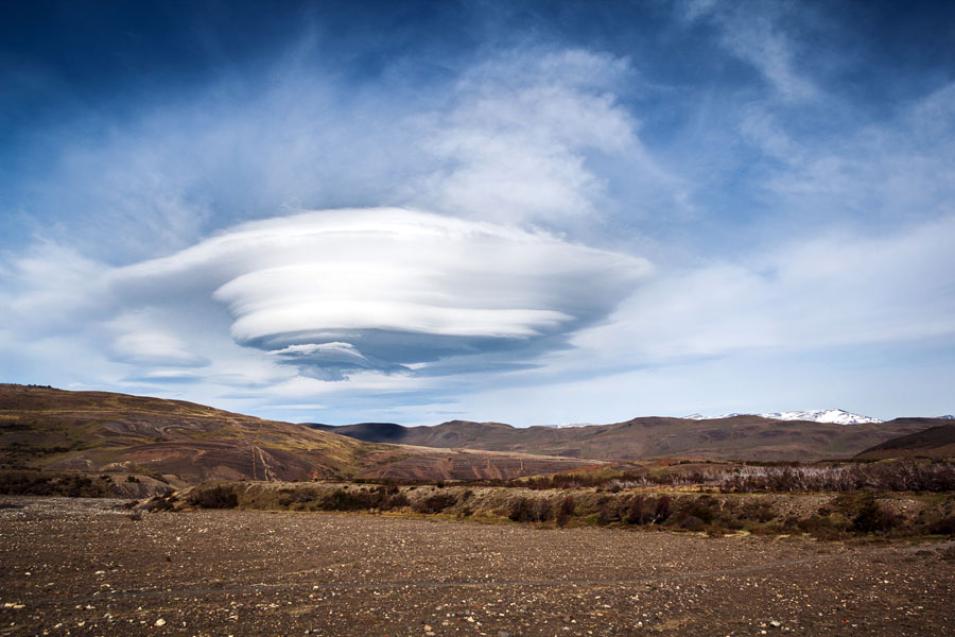
This photograph shows a large lenticular cloud hovering over part of Torres del Paine National Park, in Chile’s Patagonia region. Also called UFO clouds or cap clouds, lenticular clouds make it possible to get a rare glimpse at the crests of gravity waves. When air rushes over mountains and the conditions are right, with cold air and water vapor condensing into droplets, lenticular clouds form at the crest of the waves. (Courtesy klausbalzano/Flickr)

Serious air waves

Neil Hindley, Wright’s colleague, said, “If we could see them, we’d see the atmosphere as a large undulating mass of all kinds of waves going in all sorts of different directions, mostly from the bottom up.” Like the surface of the ocean, the atmosphere is never still, driving weather and climate.

But unlike the ocean, the atmosphere has no lid, so gravity waves tend to propagate up and up. When they finally break, as ocean waves breaking on a shore, these waves of air crash and release their energy into the upper atmosphere. That can force winds to blow in different directions and amp up circulation in the atmosphere.

Hindley went on to describe the reasoning behind their name. Not to be confused with gravitational waves, which are phenomena that occur in space, gravity waves are of this world. “If I imagine myself as a pebble in a stream, the water has to flow up and over me and then down the other side,” he said. “When the water goes over the other side, it falls back down under gravity.” On the surface, water moves up and down, oscillating under gravity and creating a lasting rippling effect. This happens in the atmosphere, too, but instead of water flowing over a pebble, air flows over mountains.

Most notably, strong westerly winds flow over the mountains of the southern Andes and the Antarctic Peninsula, and are ideal conditions for generating gravity waves. Violent thunderstorms over the Southern Ocean or fluctuations in the jet stream can also create them. Wright said, “There’s a massive peak of gravity waves over the Andes that is often ten times bigger than the rest of the world.”

Nick Mitchell, also at the University of Bath, said, “Say you have a thunderstorm over the horizon. Ocean waves will flow away from the thunderstorm and break on the beach thousands and thousands of miles away from where the storm was. These do the same thing. They take energy and momentum from the lower atmosphere to the edge of space and, in so doing, influence the circulation of the atmosphere.”
Image
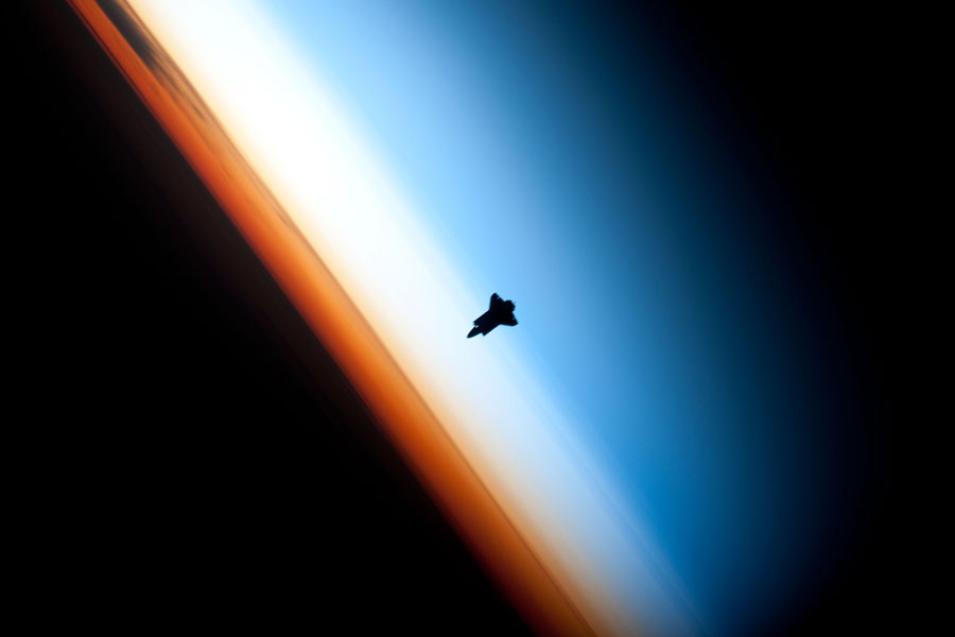
This photograph shows the Space Shuttle Endeavour as it appears to travel between two different layers of the atmosphere: the mesosphere (blue section) and the stratosphere (ivory middle section). The orange band is the troposphere, the layer of the atmosphere where our planet’s clouds and weather occur. The photograph was taken from the International Space Station as the Endeavour orbits approximately 321 kilometers (200 miles) above the Earth, far higher than the boundary between the mesosphere and troposphere, at approximately 50 to 60 kilometers (31 to 37 miles). (Courtesy NASA)

Cloak of invisibility

If those waves are not accounted for in a model, it can skew a prediction. “They’re a pain,” Hindley said. “We don’t really know where they are or what they’re doing.”

Knowing more about the waves would have practical implications, too. “It might not tell us whether it will rain at your auntie’s barbeque tomorrow,” he said, “but it is essential if you want to predict record hot summers or freezing cold winters in the coming months and years.” And for climate change predictions ten to twenty years down the line, these stratospheric waves can have a big impact.

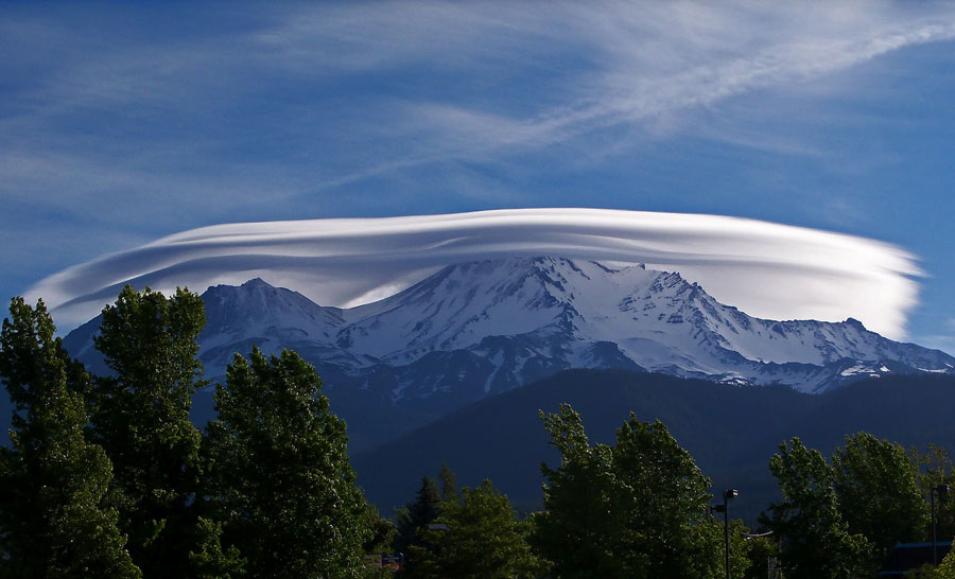
Though usually invisible to the naked eye, it is possible to see small sections of gravity waves. When conditions are just right, with the right mix of cold air and water vapor, lenticular clouds can form at the crest of the waves as they rush over mountains. These clouds are often called “cap clouds” or “UFO clouds” because they appear to cap or hover over mountain peaks.

Gravity waves are a real challenge because they are largely invisible to climate and weather models. The crux of the problem is the way satellites see them. Satellite instruments sweep the atmosphere in either a vertical or horizontal plane, so their measurements are either one- or two-dimensional. That is helpful, but does not reveal critical clues, such as the direction the waves are moving, or how fast.

As a result, satellites only capture one side of a wave. This is like trying to measure a sheet of paper by looking at its edge. For a few measurements, this simply gives a one- or two-dimensional glimpse of the waves. For the millions of measurements needed in a model, that limited view skips many waves altogether. Mitchell said, “We are missing waves and we know it’s because the models aren’t representing gravity waves properly.” Models of winter over the Antarctic and Southern Ocean, for instance, show far fewer waves than they think must be present in the real atmosphere.

The researchers were stumped. Satellites offer a much-needed global view, but how could they harness them to fully capture gravity waves?

Image
This photograph shows a large lenticular cloud over Mount Shasta in northern California. Lenticular clouds make it possible to get a rare glimpse of gravity waves, or at least small sections of them, that would otherwise be invisible. Gravity waves are often generated by air rushing over mountains. When conditions are right, lenticular clouds form at the crest of the waves, where cold air and water vapor condense into droplets. (Courtesy Sharon on Mt. Shasta/Blogspot)

Cracking the case

Then Wright thought: Why not combine the vertical and horizontal data? For that to work, he would need to find a pair of satellite instruments orbiting one another closely so their measurements would line up. Without this, there would be more errors than meaningful data.

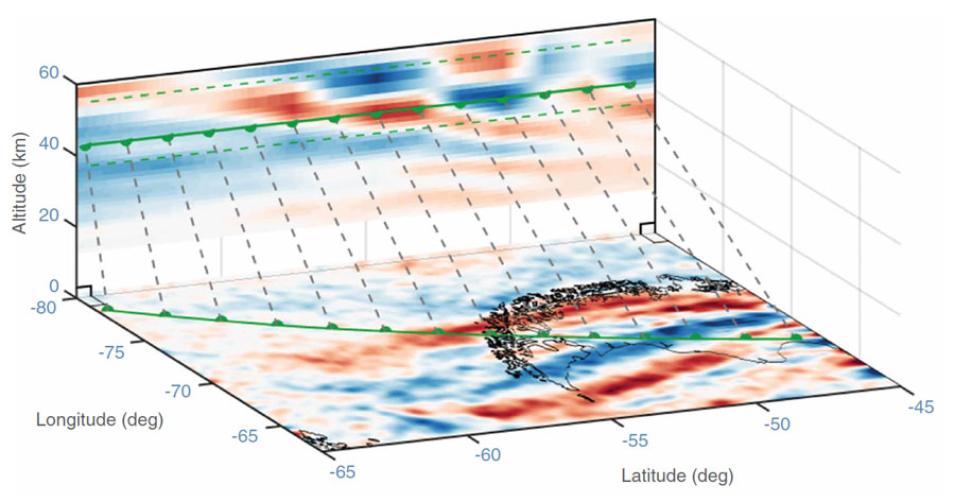
He found such a pair in the Microwave Limb Sounder (MLS) and the Atmospheric Infrared Sounder (AIRS). These instruments are mounted on satellites in the A-Train, a series of NASA satellites that follow each other in the same orbit and, in this case, just over a minute apart. With MLS looking vertically and AIRS horizontally, the two instruments thoroughly scan the atmosphere for variations in temperature. The team combed through the new data, tweaking their process along the way. They knew they were onto something.

“It’s like a movie,” Hindley said. “‘Come see gravity waves. Now in 3D.’” By combining the data, they found the more complete view of the waves that had been lacking. And with that, they can more accurately estimate the speed and force of gravity waves. That information is key. It allows them to track the direction the waves are traveling, which in turn helps them determine if gravity waves are forcing winds to speed up or slow down, and where.

“We can now use that information to piece together the story of the waves,” Wright said. That means that, for the first time, they will also be able to work out the overall effect that gravity waves have on the atmosphere, which will help improve the task of predicting weather and climate. Their only worry now is that the data will run dry. Mitchell said, “I lie awake worrying about the satellites failing. Many of them are quite old.” If that were to happen, perhaps Mitchell and his colleagues would need to consider donning spacesuits and collecting the data themselves.

Image
This figure shows combined temperature measurements from the Atmospheric Infrared Sounder (AIRS) and Microwave Limb Sounder (MLS) instruments for May 6, 2008. Gravity waves reveal themselves in the cooler temperatures (dark blue) and their forms correspond with both sets of data; dark blue indicates temperatures at -20 degrees Kelvin and dark red at 20 degrees Kelvin. White indicates a temperature of 0 degrees Kelvin. MLS readings are shown on the vertical plane (top) and AIRS on the horizontal plane (bottom). Green semicircles show identical points in both planes, with MLS atmospheric measurement locations at an altitude of 42 kilometers (26 miles). The data have been interpolated (a process of taking two known measurements and estimating the value between them) and scaled for visual clarity. (Courtesy C. Wright, et al., 2016, Geophysical Research Letters)

References

NASA Goddard Earth Sciences Data and Information Services Center (GES DISC)/AIRS Science Team/Moustafa Chahine. 2007. AIRS/Aqua L1B infrared (IR) geolocated and calibrated radiances V005 (AIRIBRAD), version 005. Greenbelt, MD, USA. http://disc.gsfc.nasa.gov/uui/datasets/AIRIBRAD_V005/summary.

NASA Goddard Earth Sciences Data and Information Services Center (GES DISC)/EOS MLS Science Team. 2011. MLS/Aura level 2 temperature V003 (ML2T), version 003. Greenbelt, MD, USA. http://disc.gsfc.nasa.gov/uui/datasets/ML2T_V003/summary.

Wright, C. J., N. P. Hindley, and N. J. Mitchell. 2016. Combining AIRS and MLS observations for three-dimensional gravity wave measurement. Geophysical Research Letters 43: 884–893. doi:10.1002/2015GL067233.

For more information

NASA Goddard Earth Sciences Data and Information Services Center (GES DISC)

About the remote sensing data
Satellites Aqua Aura
Sensors Atmospheric Infrared Sounder (AIRS) Microwave Limb Sounder (MLS)
Data sets AIRS/Aqua L1B Infrared (IR) Geolocated and Calibrated Radiances V005 (AIRIBRAD.005) MLS/Aura Level 2 Temperature (ML2T.003)
Resolutions 13.5 kilometer 1.5 to 6 kilometer
Parameters Brightness temperatures Brightness temperatures
DAACs NASA Goddard Earth Sciences Data and Information Services Center (GES DISC) NASA GES DISC
Last Updated