On December 16, 1811, an earthquake estimated at magnitude 7.0 to 8.0 on the Richter scale rocked the frontier town of New Madrid, Missouri, in the central United States. It was the first of three powerful earthquakes that would shake the central Mississippi River Valley that winter. Damages were reported as far away as Charleston, South Carolina, and Washington, D.C. According to the U.S. Geological Survey, the New Madrid events were the most powerful earthquakes in recorded U.S. history.
Squeezing Water from Rock
Survivors of the New Madrid earthquakes reported not only intense ground shaking and land movement, as would be expected during an earthquake, but also an unfamiliar phenomenon: water and sand spouting up through fissures, or cracks, in the Earth’s surface. In a letter published in Lorenzo Dow’s Journal, New Madrid resident Eliza Bryan wrote in 1816:
. . . the surface of hundreds of acres was, from time to time, covered over in various depths by the sand which issued from the fissures, which were made in great numbers all over this country, some of which closed up immediately after they had vomited forth their sand and water . . .
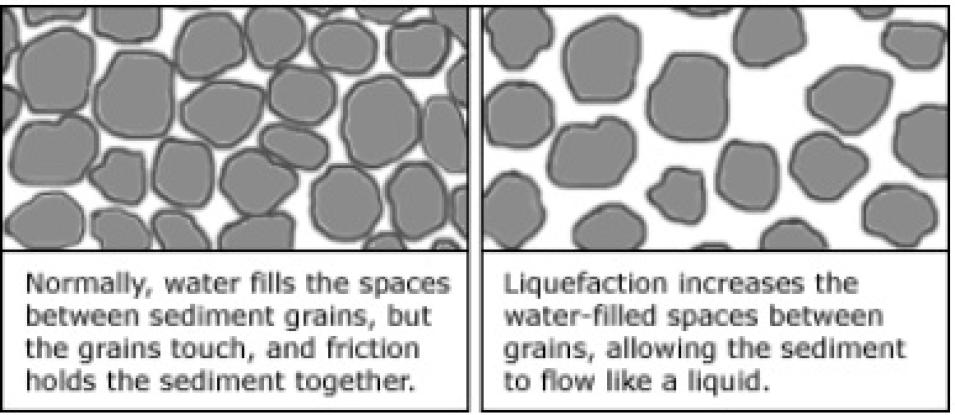
Modern earthquake researchers refer to this expulsion of water and sand from the ground as earthquake dewatering, which results from liquefaction. Liquefaction occurs when an earthquake vigorously shakes and compacts water-saturated sediments. As the compaction process displaces the water between the sediment pores, water and sand shoot upward and out of the ground.
“Imagine a cube full of sand and water. If you press it in from both sides (compressing and releasing it, then compressing it again), you build up what’s called pore-water pressure,” said Martitia Tuttle, geologist and consultant for the U.S. Geological Survey. “It’s like shaking a coke can — when the pressure builds up and you release it, the fluid comes shooting to the surface.” These fountains of water can sometimes shoot as high as 30 feet into the air, according to Tuttle.
Tuttle is part of a team that has been studying liquefaction in the New Madrid region in an effort to identify large prehistoric earthquakes in the geologic record. “Interpreting historic and prehistoric earthquake events involves a lot of uncertainty, due to the lack of data,” Tuttle said. “We often don’t know precisely where the earthquakes occurred or how big they were.” What researchers needed was a modern-day event in a similar environment with which to compare the New Madrid earthquakes.
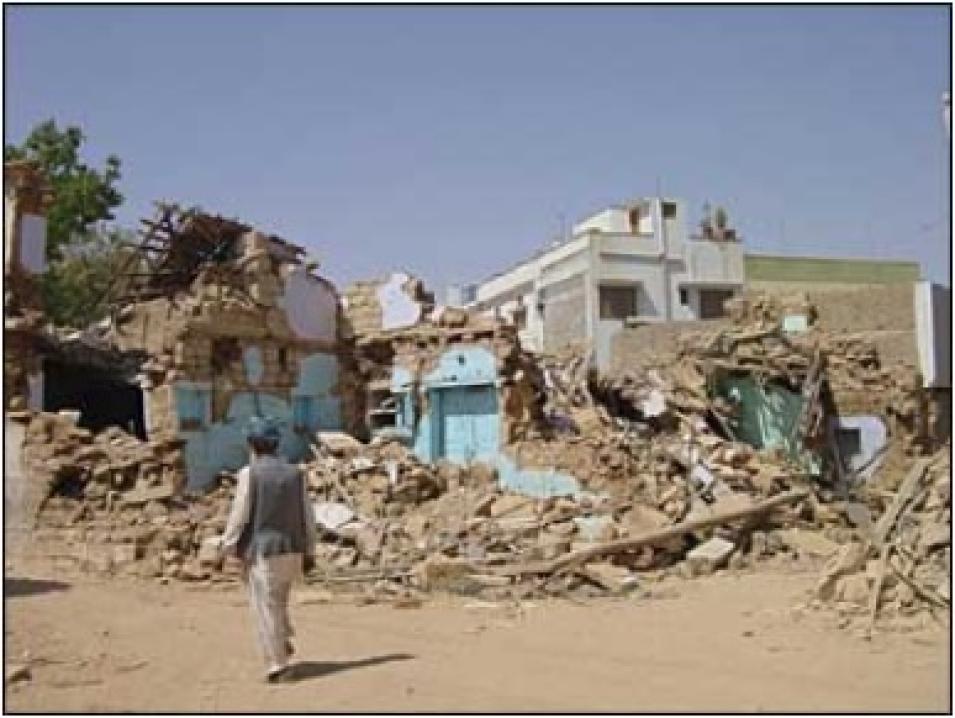
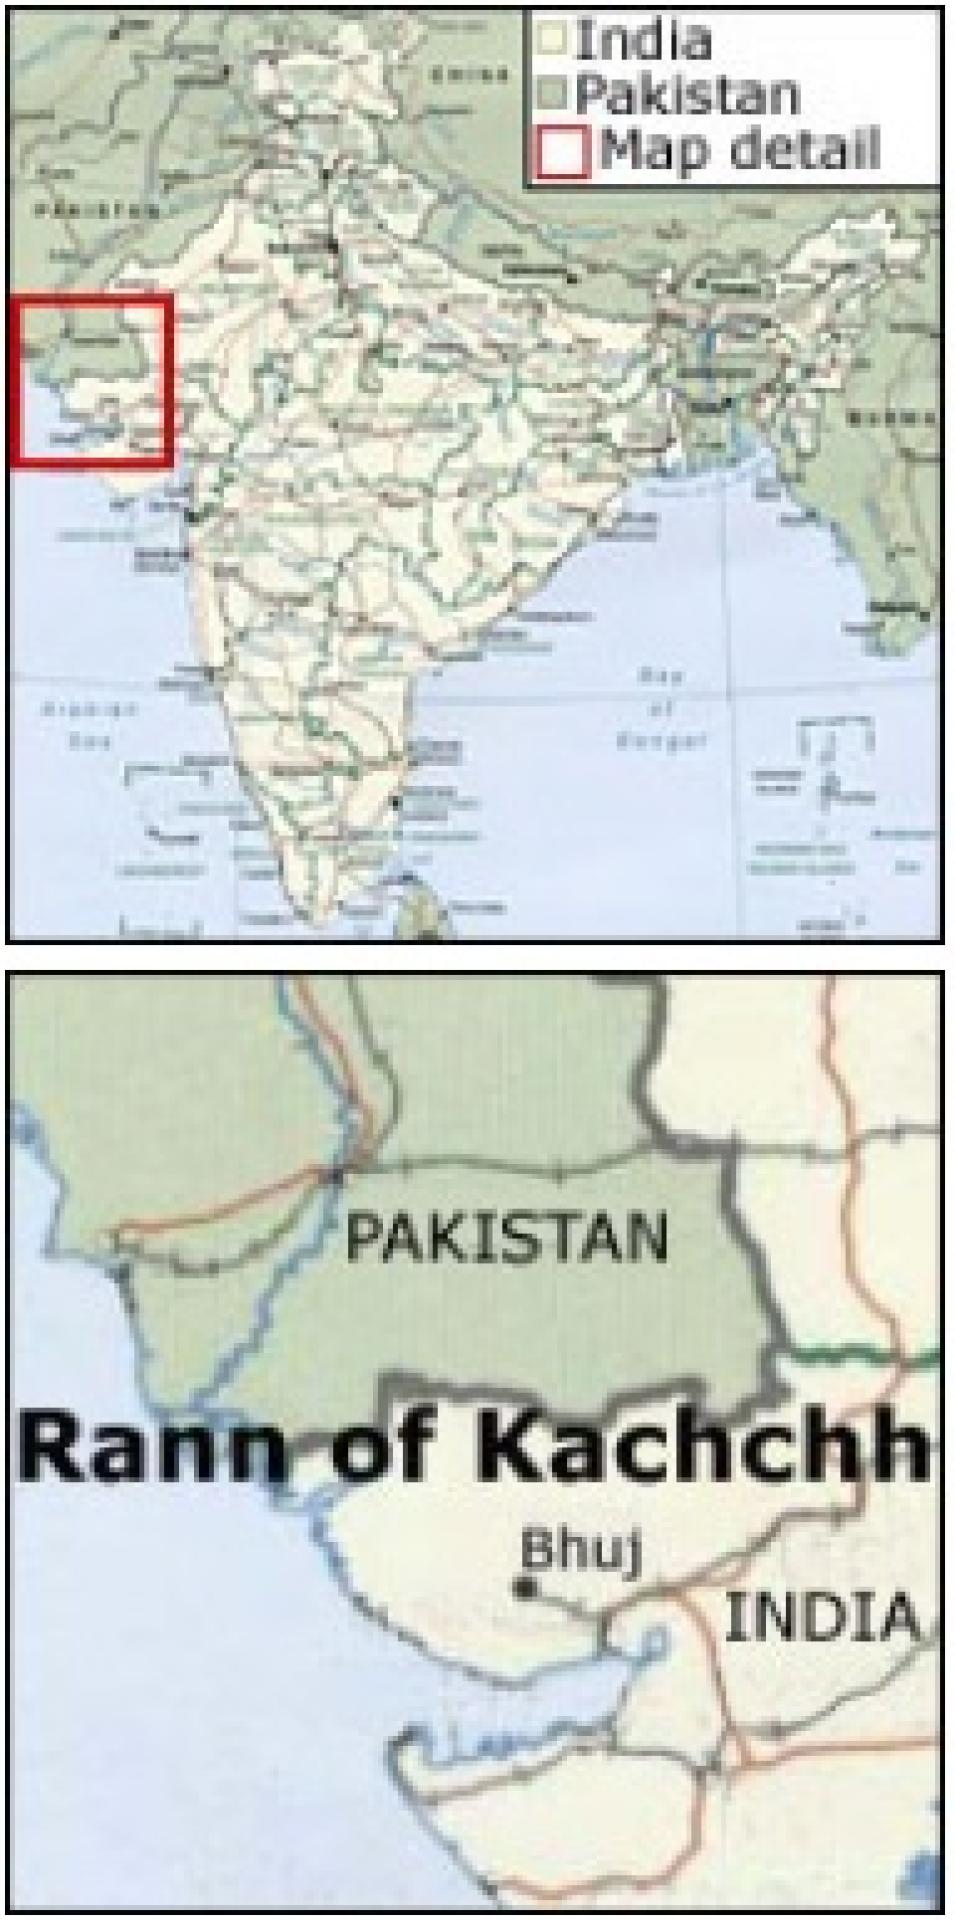
On January 26, 2001, a magnitude 7.7 earthquake near the village of Bhuj, located in the Kachchh region of northwestern India, provided scientists with just that analogue. Considered one of the two most damaging earthquakes in India’s recorded history, the Bhuj earthquake killed about 20,000 people and caused an estimated $3.3 billion in damages.
According to Tuttle and co-authors of a paper recently published in Eos, local residents and survey teams working in the area after the earthquake reported fountains of water and sediments surging from the ground during and immediately following the Bhuj earthquake. The water flow was significant enough to reactivate streams in previously dry river channels.
“The Bhuj earthquake provided an opportunity to study an earthquake that was very similar to the New Madrid event — it was a very large earthquake, and it occurred in an intraplate-like setting,” said Tuttle. The New Madrid and Kachchh regions are both located more than 185 miles (300 kilometers) from active plate boundaries.
“Before the Bhuj earthquake, there was a lot of debate in the seismological community about the magnitude of the New Madrid earthquakes, but based on the similarity in intensity between the New Madrid and Bhuj events, there is a growing consensus among scientists that the New Madrid earthquakes were probably larger than magnitude 7.5,” said Tuttle. “The Bhuj earthquake is a modern event that helps us better understand the historic and prehistoric earthquake record in the New Madrid region.”
But despite the unique study opportunity presented by the Bhuj earthquake, the area presented the researchers with some grave challenges. First, the Kachchh region of India is remote and difficult to reach. Second, it shares a politically sensitive border with Pakistan. These factors made it difficult for research teams to conduct field studies to verify liquefaction effects or the presence of water in some areas.
Bernard Pinty, research scientist at the Institute for Environment and Sustainability in the Joint Research Centre of the European Commission in Ispra, Italy, and colleagues found that water expelled during the earthquake could be detected in imagery from NASA’s Multi-angle Imaging SpectroRadiometer (MISR) satellite sensor.
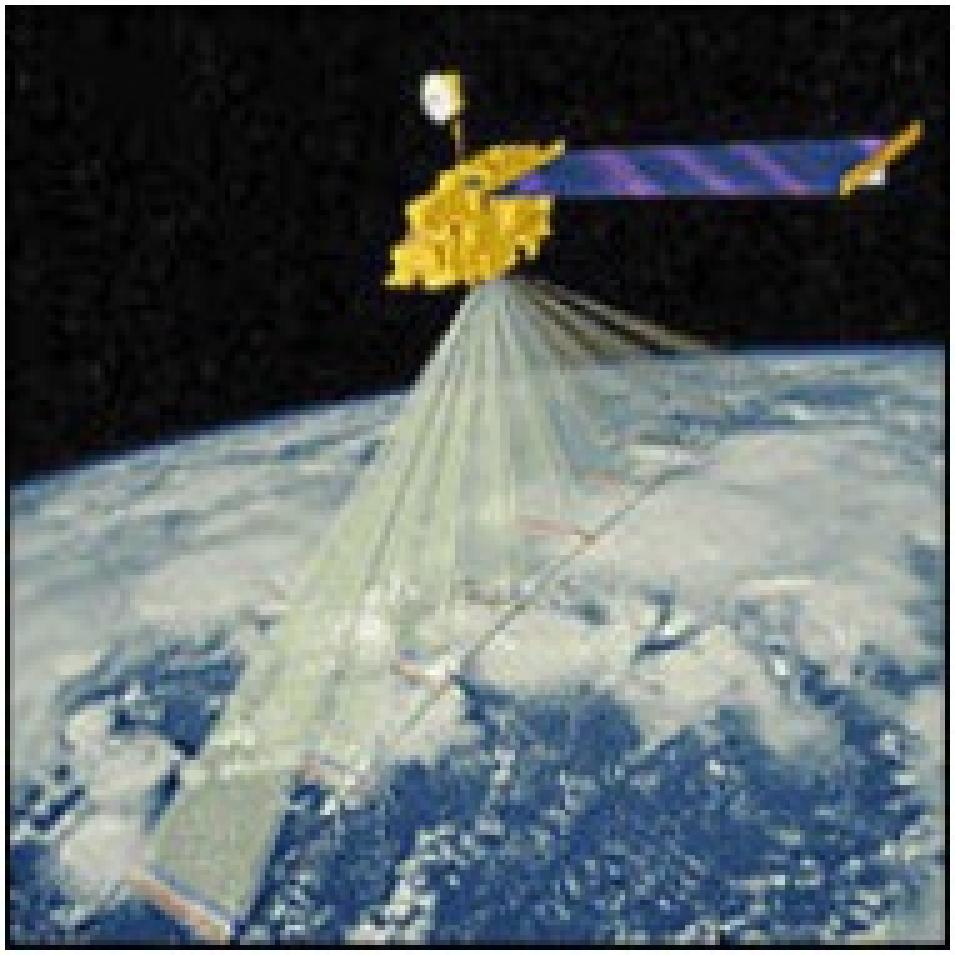
The MISR instrument, which flies aboard NASA’s Terra satellite, views the sunlit face of the Earth at nine widely spaced angles simultaneously. As it passes over the Earth, its nine cameras successively view each piece of the planet’s surface at a spatial resolution of 300 yards (275 meters).
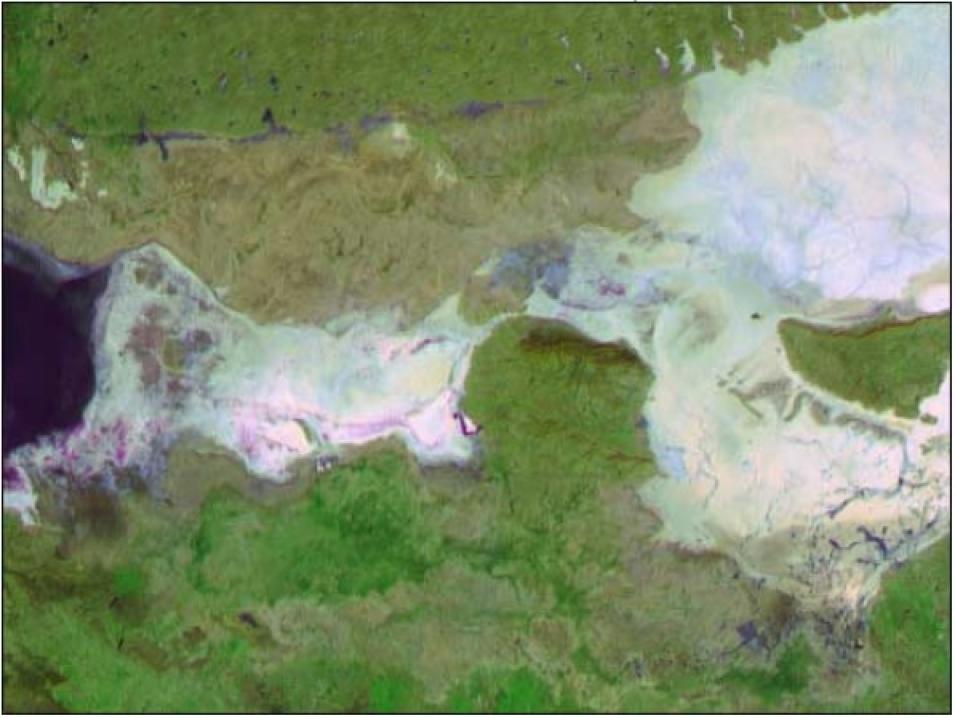
The change in reflection at different angles provides a means for distinguishing different types of land surface covers. Since bright soils in India’s Rann of Kachchh (also known as the Rann of Kutch) reflect most of the sun’s near-infrared radiation, and water bodies absorb near-infrared radiation, MISR is able to detect the contrast and indicate where dewatering occurred.
According to Pinty, these features made MISR an ideal tool for studying liquefaction in the Bhuj earthquake. “MISR’s multi-angle capability was instrumental in exposing the presence of free water close to the Pakistani border, a region where it is difficult, if not impossible, to take ground measurements,” he said.
Most other satellite instruments only look straight down or towards the edge of the Earth. “It would take several more passes for another sensor to capture the entire region that the MISR imagery covers,” said Tuttle. “The MISR images enabled us to see a large area both during and immediately after the earthquake, and we could see that dewatering was occurring over a huge region.”
This false-color MISR image was acquired after the Bhuj earthquake, on January 31, 2001. The image shows numerous areas where groundwater flowed up to the surface, including within the Rann of Kachchh, as well as near the Indo-Pakistani border. (Image courtesy of NASA/GSFC/LaRC/JPL, MISR Team).
Scientists now know that the New Madrid earthquakes were not geologic flukes; similar events have occurred repeatedly in the geologic past. In fact, the central Mississippi Valley experiences more earthquakes than any other region in the United States east of the Rocky Mountains.
The New Madrid Seismic Zone, which includes parts of Tennessee, Kentucky, Missouri, Arkansas, Illinois, Indiana, and Mississippi, harbors a large liquefaction field. Scientists estimate the probability of a magnitude 6.0 or greater earthquake occurring in the New Madrid Seismic Zone within the next 50 years at 25-40 percent, according to the U.S. Geological Survey. But a similar event would have much more serious consequences today.
In 1811-1812, the central Mississippi Valley was a remote frontier. Today, the region is home to millions of people and includes the metropolitan cities of St. Louis, Missouri, and Memphis, Tennessee. In addition, most buildings in the region were not built to withstand earthquake shaking, as they often are in California and Japan.
Buildings and engineered structures are at much higher risk in areas where liquefaction occurs, due to increased ground motion. “The liquefaction process is extremely damaging to all sorts of engineered structures; it has caused major destruction in both Anchorage and San Francisco,” said Pinty.
“The ground failure that resulted from liquefaction during the New Madrid earthquakes was severe. We’re talking about vertical displacement of 3 to 6 feet (1 to 2 meters), and lateral displacement up to 33 feet (10 meters),” said Tuttle. “A recurrence of that type of event would have severe consequences for engineered structures.”
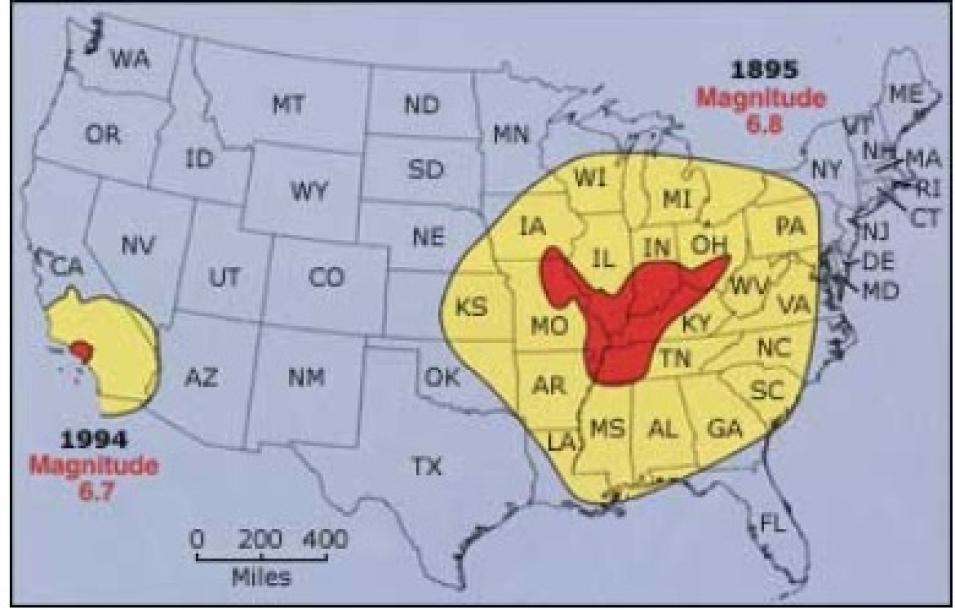
Although earthquakes in the central and eastern United States are less frequent than in the western United States, they affect much larger areas. This is shown by two areas affected by earthquakes of similar magnitude — the 1895 Charleston, Missouri, earthquake in the New Madrid Seismic Zone and the 1994 Northridge, California, earthquake. Red indicates regions of minor to major structural damage; yellow indicates areas where shaking was felt, but little or no damage to objects occurred. (Image courtesy of the U.S. Geological Survey).
According to Tuttle, in 1988 a magnitude 5.9 earthquake in Quebec, Canada, produced liquefaction. “Basements cracked, septic fields were disrupted, and people described water and sand shooting into their basements, out of their toilets, and into their bathtubs,” she said. “And that was just a moderate-sized earthquake, not a big one.”
MISR imagery, which is archived at NASA's Atmospheric Science Data Center (ASDC), promises to be a boon to earthquake researchers seeking to minimize hazard risks. “The interesting thing is that this project started as an ‘after hours’ sort of activity,” said Pinty. “But it soon acquired its own momentum, giving us results that are of significant relevance to earthquake study applications. Our findings revealed that MISR can detect water and moist conditions on terrestrial surfaces, even under unfavorable spectral conditions.”
“If we study modern earthquakes that produce liquefaction, we can better interpret the geologic record of liquefaction during past events. This helps us anticipate what is likely to happen in the future so that we can make informed decisions about reducing and mitigating hazards,” said Tuttle.
“It’s one of those things where people tend to think — if it hasn’t happened during my lifetime, then it can’t happen here,” said Tuttle. “But the liquefaction field in the New Madrid region is very large. We’re talking about a huge earthquake that could have a significant impact on society.”
References
Bryan, E. 1849. New Madrid, Territory of Missouri, March 22, 1816. In Lorenzo Dow's Journal. Published by Joshua Martin: 344-346. Quoted by The Virtual Times, The New Madrid Earthquake. Accessed June 5, 2003.
Pinty, B. et al. 2003. Observing earthquake-related dewatering using MISR/Terra satellite data. EOS, Transactions, American Geophysical Union. 84(5):37-48.
Tuttle, M.P. 2001. The use of liquefaction features in paleoseismology: Lessons learned in the New Madrid seismic zone, central United States. Journal of Seismology. 5:361-380.
Tuttle, M.P., J. Hengesh, K.B. Tucker, W. Lettis, S.L. Deaton, and J.D. Frost. 2002. Observations and comparisons of liquefaction features and related effects induced by the Bhuj earthquake. Earthquake Spectra. 18(Supp. A):79-100.
For more information
NASA Atmospheric Science Data Center (ASDC)
| About the remote sensing data used | ||
|---|---|---|
| Satellite | Terra | |
| Sensor | Multi-angle Imaging SpectroRadiometer (MISR) | |
| Parameter | liquefaction | |
| DAAC | NASA Atmospheric Science Data Center (ASDC) | |
