After the Larsen B

Researchers study the aftermath of the collapse of an Antarctic ice shelf to find out what might happen next.
author-share

In March 2002, scientists witnessed the largest ice shelf breakup in recent history. Within 35 days, more than 3,250 square kilometers (1,255 square miles) of the Larsen B ice shelf in Antarctica shattered into small icebergs. Researchers were stunned by the rapidity of its collapse, even though they knew the shelf was weakened. For several years prior to the breakup, scientists had been using satellite images and other data to study the shelf. These data revealed a critical combination of factors: rising air temperatures and increased melting on the ice surface. A succession of unusually warm summers had increased the amount of melt water on the surface of the ice, which then wedged open crevasses in the ice, weakening and ultimately breaking up the shelf.

The Larsen B ice is gone forever, but it left behind questions that scientists are now trying to answer in more detail. Ice shelf collapses not only change the shape of Antarctica’s icy fringe: they could soon raise global sea level.

Image
Larsen B ice shelf
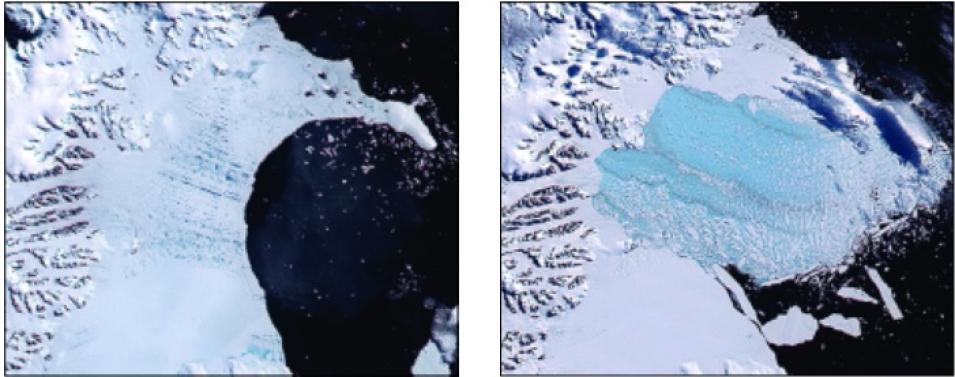
Between January 31 and March 7, 2002, the Larsen B ice shelf shattered, sending 3,250 square kilometers (1,255 square miles) of ice into the ocean. The January 31 image (left) shows the shelf in late austral summer, with dark blue melt ponds dotting its surface. By March 7 (right), the shelf disintegrated, leaving thousands of sliver icebergs and a large area of finely divided bits of ice where the shelf had been. These images were captured by NASA’s Moderate Resolution Imaging Spectroradiometer (MODIS) instrument. (Courtesy NSIDC)

Ice shelves and sea level

The Antarctic Peninsula is a craggy finger of land jutting north from the continent’s mainland toward the tip of South America. Home to some of Antarctica’s smaller glaciers and ice shelves, the Peninsula’s ice seems insignificant compared to East Antarctica’s thick ice blanket and West Antarctica’s giant interior ice sheet. But the Peninsula is highly sensitive to warming polar winds, making the region’s glaciers and ice shelves a real-time laboratory that is revealing how the rest of Antarctica may respond to climate change.

For years, scientists debated how Antarctica’s glaciers might respond to the loss of an ice shelf; understanding glacier behavior is critical for predicting global sea-level rise. An ice shelf itself does not contribute to sea-level rise. Like an ice cube in a glass of water, the floating ice is already displacing its own volume in the ocean. Once an ice shelf collapses, however, scientists theorized that the glaciers that feed into it would no longer be held at bay by the ice shelf ’s mass. Freed of the barrier, the glaciers would send torrents of ice into the embayment far more rapidly than before the breakup. Some glaciers that flow into the major West Antarctic ice shelves hold so much ice that if they were to slip into the ocean suddenly, they could raise sea level by five to seven meters (sixteen to twenty-three feet), according to NASA. Even a one-meter (three-foot) sea-level rise would inundate shorelines around the world, including heavily populated coastal areas in southeastern Asia, Australia, parts of Europe, and the Atlantic and Gulf coasts of the United States.

Image
Antarctic glaciers
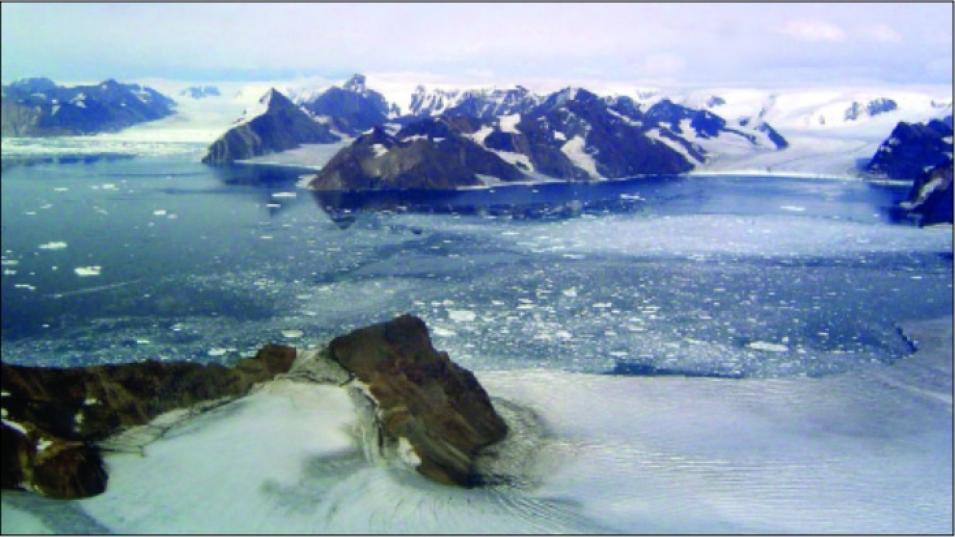
Without the buffer of the Larsen B ice shelf, several glaciers now feed directly into the embayment left behind after the shelf collapsed in 2002. From left to right are the Melville, Mapple, and Crane Glaciers; Jorum Glacier is in the foreground. (Courtesy Ted Scambos)

Ted Scambos, a glaciologist at the National Snow and Ice Data Center Distributed Active Archive Center (NSIDC DAAC), studied the Larsen B collapse and is using satellite data to observe a small remnant that the shelf left behind. Scambos said, “The Larsen B remnant is still holding back two large glaciers. While these glaciers aren’t large enough to impact sea level, they can give us another chance to watch this experiment play out again and study it in more detail.” What he and his colleagues learn may provide clues about the behavior of other ice shelves. “By continuing to watch the Larsen B area, we’ll see whether the same kind of pattern is starting to set up on some of the other large ice shelves around Antarctica, like the Fimbul or Ross ice shelves, which hold back some of the really large glaciers,” Scambos said.

The sudden breakup of the Larsen B ice shelf has spurred renewed research interest because of the implications for other ice shelves. In particular, scientists are exploring the consequences of ice shelf collapse, their role in ice sheet dynamics, and the potential increase in ice discharge. “Scientists have been taking a new look at the observations,” Scambos said, “trying to find what makes the glaciers change.”

Accelerating glaciers

Chris Shuman, at the Goddard Earth Sciences and Technology Center, is using satellite observations to examine the behavior of several glaciers that feed into the embayment formed by the Larsen B collapse. Shuman said, “These glaciers have changed markedly, with rapid ice-edge retreat of tens of kilometers [up to a dozen miles]. The fronts of almost all the glaciers in the area exposed in early 2002 have retreated.”

As the retreating glaciers accelerated, their ice stretched and thinned out. Shuman and colleagues tracked this thinning using data archived at NSIDC DAAC from NASA's Geoscience Laser Altimeter System (GLAS) instrument, flying on the Ice, Cloud, and Land Elevation Satellite (ICESat). ICESat’s near-polar orbit repeatedly crosses the Antarctic Peninsula’s glaciers and shows how they have thinned over the years since the Larsen B collapse.

Image
fragmented glacier ice
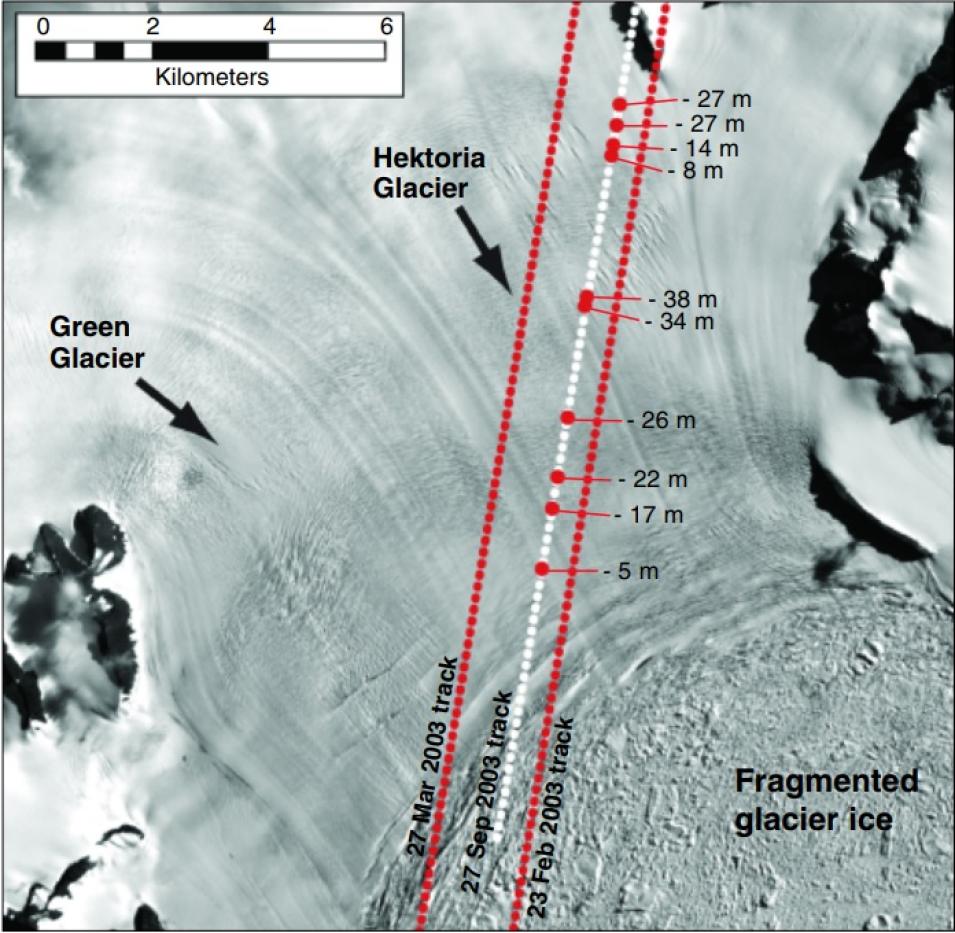
After the 2002 Larsen B ice shelf collapse, glaciers in the embayment emptied directly into the ocean. Without the buffer of an ice shelf, the glacier’s flow accelerated, stretching and thinning the ice. This image shows how two of the glaciers thinned between five and thirty-eight meters after the collapse. Dotted red lines and white lines indicate satellite laser tracks that were overlaid on a Landsat image of the area; large red dots indicate locations with surface elevation data. The laser measurements are from the Geoscience Laser Altimeter System (GLAS) aboard the Ice, Cloud, and Land Elevation Satellite (ICESat) mission. (Courtesy NSIDC)

To measure this thinning, Shuman mapped the ICESat data onto satellite images of the area’s glaciers, captured by the Moderate Resolution Imaging Spectroradiometer (MODIS) on the Terra and Aqua satellites. He discovered that one large glacier, the Crane, thinned from 16 to 150 meters (53 to 492 feet) during the five years following the Larsen B breakup. “The glaciers that are still buttressed by the Larsen B remnant have changed very little, while the ice shelf collapse caused increased glacial ice flow and ice loss on the Crane Glacier,” said Shuman. The Crane’s ice-edge retreat and dramatic thinning, tens of kilometers (up to a dozen miles) inland, indicates significant change, especially compared to two other glaciers still blocked by the Larsen B remnant.

Even the Larsen B remnant is shrinking. “The Larsen B embayment, especially the remnant, has lost another 1,700 square kilometers [656 square miles] of ice area since 2002, including a large iceberg that calved early in 2006,” Shuman said. Under normal conditions, icebergs periodically calve off of the front edge of an ice shelf, helping the shelf maintain equilibrium, but a large iceberg calving from a rapidly receding shelf may indicate instability.

The Larsen B glaciers may be following the same pattern observed in other recent ice shelf collapses. Neil Glasser, at the University of Wales, Aberystwyth, found a way to look back in time to study the behavior of another Antarctic Peninsula glacier, the Rohss Glacier, which fed into the Prince Gustav Ice Shelf prior to its 1995 collapse. He used a combination of archived images from the Landsat satellite missions, available from the United States Geological Survey, and more recent imagery from the Advanced Spaceborne Thermal Emission and Reflection Radiometer (ASTER) instrument aboard the NASA Terra satellite, available from NASA's Land Processes Distributed Active Archive Center (LP DAAC).

Glasser mapped the glacier features onto the satellite images to study the glacier’s behavior between 2001 and 2006. “In those five years, the Rohss receded about fourteen kilometers [eight miles],” he said. “And that’s interesting because that’s a long time after the shelf disappeared,” Glasser said. He also found that the Rohss glacier appeared to thin as it receded.

Combined, these findings illuminate how a larger ice shelf collapse may affect global sea level. Scambos said, “In both Greenland and Antarctica we’re seeing over and over again that when an ice shelf disintegrates, glaciers behind it accelerate abruptly, and begin to draw down significant volumes of ice and put it into the ocean.” The Larsen B shelf was about the size of Connecticut, but Antarctica’s largest ice shelves, the Ross and Ronne, are each nearly the size of Spain. If the Ross shelf collapsed, for example, the resulting flow of glacial ice could eventually raise global sea level by up to five meters (sixteen feet).

Image
MODIS Larsen B
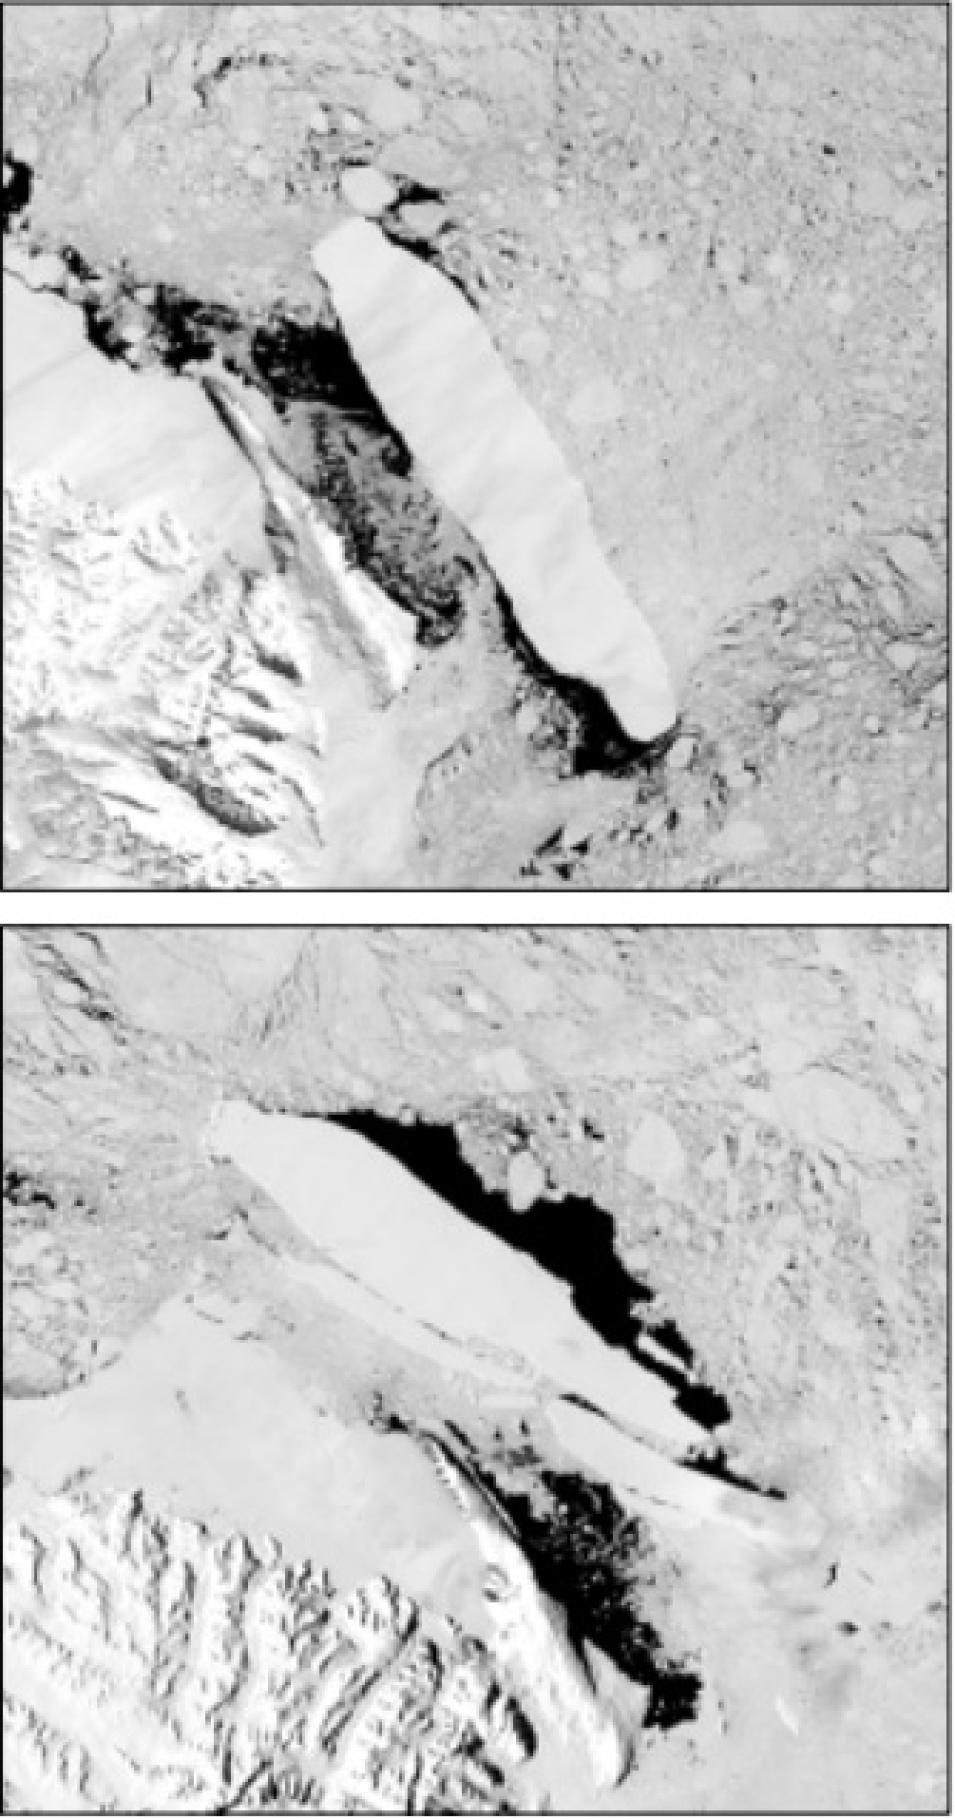
The top image shows Iceberg B-15A on October 27, 2005; the bottom image shows the iceberg on November 4, 2005, after breaking into large shards. Researchers believe the iceberg fragmented after low swells generated off Alaska rocked the iceberg against the Antarctic coast. The Moderate Resolution Imaging Spectroradiometer (MODIS) instrument on NASA’s Terra and Aqua satellites captured these images. (Courtesy NASA MODIS Rapid Response Project)

Peril an ocean away

While researchers have since learned more about the role of melt water and the effects of glacier acceleration in ice shelf dynamics, and the potential for global sea level change, the Larsen B collapse spurred researchers to develop additional theories about how and why ice shelves collapse. They learned that surface melting is only part of the story.

Douglas MacAyeal, at the University of Chicago, is pursuing a culprit that may come from halfway around the globe: ocean swells. The swells he studies are not picturesque white-capped ocean waves, but long, low, storm-generated swells that can travel for thousands of miles.

MacAyeal said, “You wouldn’t see them if you were out on the ocean, because they would have a kilometer [0.62 mile] wavelength. They’re very long.” The swells also have a low amplitude, or height, of only a few centimeters (less than an inch), making them difficult to detect without sensitive equipment. MacAyeal and his colleagues discovered the effect of these waves after an iceberg they were studying, named B-15A, abruptly shattered on October 27, 2005. B-15A was a large iceberg, about the size of Luxembourg, which had run aground off of the coast of Antarctica.

It broke up on a calm day with locally mild weather, puzzling observers. MacAyeal and his colleagues retrieved a seismometer that they had previously installed on the iceberg and analyzed the data. They discovered that just before the breakup, the seismometer recorded long, low swells that had rocked the iceberg and pounded it against the coast. MacAyeal traced the swells back to a surprising source—a giant winter storm off the coast of Alaska five thousand kilometers (eight thousand miles) away.

Even the surrounding sea ice, which usually absorbs ocean wave energy, had not protected the iceberg. “Sea ice does keep the waves from propagating if the wavelength is short, less than 100 meters [328 feet]. But these waves are so long that they just flex the sea ice,” MacAyeal said. This lack of protection could have serious consequences for ice shelves, as well as icebergs. However, these long, low swells do not act alone. “Melt water tends to fracture the crevasses and produce an ice shelf that’s broken up but hasn’t fallen apart yet,” MacAyeal said. “It’s like an old house where the mortar has come out from between the bricks but the bricks are still stacked. If the ice shelf has warmed up and weakened over a long period of time, then the next storm that comes along whacks it. It’s the waves that shake the pieces apart.” Scambos agreed, saying, “There are a lot of things happening together to cause a catastrophic ice shelf breakup, but these long-wavelength swells may be doing some of the dirty work.”

Like Glasser, MacAyeal also plans to look back in time to see if there is a connection between distant storms and previous ice shelf retreats or collapses. For instance, he is investigating the calving of iceberg B-15, the parent iceberg to B-15A. MacAyeal said, “When B-15 broke off the Ross Ice Shelf in 2000, it was thought to have been a time when there were lots of waves being recorded.” Storm-generated ocean waves are just one of many environmental triggers behind ice shelf collapse that scientists are trying to understand. And while such triggers may not contribute directly to rising sea levels, they do indicate a larger connection between global weather and the long-term stability of Antarctica’s ice masses.

The future of Antarctic ice

The long-term response of the glaciers behind the Larsen B remnant remains unknown, and continues to be an object of study. Scientists like Scambos, Shuman, Glasser, and MacAyeal are watching the Antarctic Peninsula with keen interest, observing both the post-collapse glaciers and the remaining ice shelves. Glasser said, “So far, the glaciers thin, accelerate, and recede, discharging more and more ice into the ocean each year. If you’re a glacier, that’s a pretty bad recipe.”

Accelerating glacier ice is an unwelcome ingredient in the recipe for global sea-level rise, making it important for scientists to understand the factors behind ice shelf breakup. As long as the massive Antarctic ice sheets remain locked away behind ice shelves, doled out in an occasional iceberg, sea level may remain stable. But if warming and melting trends persist, more ice shelves may begin to show the same signs of weakness observed in the Larsen B ice shelf before it disintegrated. “This problem of sea-level rise is a real one,” says Scambos. “It’s likely to happen, and the steps could proceed more rapidly than we thought.”

References

Cook, A. J., A. J. Fox, D. G. Vaughan, J. G. Ferrigno. 2005. Retreating glacier fronts on the Antarctic Peninsula over the past half-century. Science 308(5721): 541–544, doi:10.1126/science.1104235.

MacAyeal, D. R., E. A. Okal, R. C. Aster, J. N. Bassis, K. M. Brunt, L. M. Cathles, R. Drucker, H. A. Fricker, Y. J. Kim, S. Martin, M. H. Okal, O. V. Sergienko, M. P. Sponsler, and J. E. Thom. 2006. Transoceanic wave propagation links iceberg calving margins of Antarctica with storms in tropics and Northern Hemisphere. Geophysical Research Letters 33, L17502, doi:10.1029/2006GL027235.

NASA Goddard Institute for Space Studies. Sea level rise, after the ice melted and today. https://www.giss.nasa.gov/research/briefs/gornitz_10/. Accessed October 3, 2007.

Scambos, T. A., J. A. Bohlander, C. A. Shuman, and P. Skvarca. 2004. Glacier acceleration and thinning after ice shelf collapse in the Larsen B embayment, Antarctica. Geophysical Research Letters 31, L18402, doi:10.1029/2004GL020670.

For more information

NASA Land Processes Distributed Active Archive Center (LP DAAC)

NASA National Snow and Ice Data Center DAAC (NSIDC DAAC)

Advanced Spaceborne Thermal Emission and Reflection Radiometer (ASTER)

Ice, Cloud, and Land Elevation Satellite (ICESat)

Landsat

Moderate Resolution Imaging Spectroradiometer (MODIS)

NASA Earth Observatory: Fragment of its Former Shelf

About the remote sensing data
Satellites Terra Terra and Aqua Ice, Cloud, and Land Elevation Satellite (ICESat)
Sensors Advanced Spaceborne Thermal Emission and Reflection Radiometer (ASTER) Moderate Resolution Imaging Spectroradiometer (MODIS) Geoscience Laser Altimeter System (GLAS)
Data sets ASTER L1A Reconstructed Unprocessed Instrument Data MODIS Mosaic of Antarctica GLAS/ICESat L2 Antarctic and Greenland Ice Sheet

Altimetry Data
Resolution 15, 30, or 90 meters 125 by 125 meters 60-meter spots separated by 172 meters
Parameters Land ice Land ice Elevation
DAACs NASA Land Processes Distributed Active Archive Center (LP DAAC) NASA National Snow and Ice Data Center DAAC (NSIDC DAAC) NASA NSIDC DAAC
Last Updated