Dr. Adam Storeygard

Who uses NASA Earth science data? Dr. Adam Storeygard, for economic studies of urbanization and development.

Dr. Adam Storeygard, Associate Professor of Economics, Tufts University, Medford, MA

Research interests: Urbanization, transportation, and the economic geography of the developing world, including research to explain city growth in sub-Saharan Africa.

Research highlights: The Greek word oikos means “house.” But the concept of oikos extends beyond a mere building. It also can refer to a family or any dwelling area, such as a community or even a nation. When combined with Greek suffixes, oikos becomes an even more encompassing—and interesting—word.

Adding the Greek suffix -logia, which can be defined as “the study of,” to oikos creates a word meaning “the study of the house”—what we more commonly recognize as the contemporary word ecology. Adding the Greek suffix -nomos, which can be translated as “law, custom, or management,” gives us the contemporary word economy. The study of the house (ecology) and the management of the house (economy) are intertwined, and the connection is much more than mere etymology.

In fact, NASA’s Earth Observing System Data and Information System (EOSDIS) maintains a large socioeconomic data collection that is archived at and distributed by NASA’s Socioeconomic Data and Applications Center (SEDAC), which is one of the EOSDIS’ discipline-specific Distributed Active Archive Centers, or DAACs. Hosted by the Center for International Earth Science Information Network (CIESIN) at Columbia University, SEDAC serves as an “Information Gateway” between the socioeconomic and Earth science data and information domains, and synthesizes Earth science and socioeconomic data and information in ways useful to a wide range of decision makers and other applied users. Dr. Adam Storeygard is one of these applied users.

Remotely-sensed data from orbiting sensors designed to study our home planet are integral components of Storeygard’s economic research into urbanization, transportation, and the developing world. The data collected by these satellite-borne instruments, particularly nighttime lights data, help him analyze economic development in remote or developing areas.

Storeygard’s specific research focus is sub-Saharan Africa, a vast region that encompasses all African nations partially or fully located south of the Sahara Desert. The roughly one billion residents of this region have a life expectancy of about 61 years (up from 40 years in 1960) and 41% live in extreme poverty, according to the United Nations Development Programme. Relying on traditional economic measurements for research into the productivity and development of this region brings a unique set of challenges.

For example, one foundational economic measurement is a country’s Gross Domestic Product, or GDP. GDP is the total value of goods produced and services provided in a country during one year. However, tracking economic activity in developing countries or remote regions is difficult. As noted by the World Bank, “Many statistical offices, especially those in developing countries, face severe limitations in the resources, time, training, and budgets required to produce reliable and comprehensive series of national accounts statistics.” A key difficulty is the inability to account for unreported economic activity, such as informal transactions or agricultural production that is consumed rather than marketed. These “hidden” transactions likely represent a larger share of the economy in many developing countries. For Storeygard, getting accurate GDP metrics for sub-Saharan Africa required a different approach.

Storeygard decided to use remotely-sensed nighttime lights data as a proxy for economic activity, and notes that nighttime lights data address two problems with GDP. For one, nighttime lights data are globally consistent, which enables them to be combined with more traditional sources of economic data to provide improved estimates of economic growth for countries with weak statistical systems. Secondly, traditional measures of economic activity are often unavailable for sub-regions within countries in the developing world (such as states, municipalities, or counties).

His primary source for nighttime lights data is the Defense Meteorological Satellite Program (DMSP) series of satellites. The first DMSP satellite was launched in 1962, and the program is jointly run by the National Oceanic and Atmospheric Administration (NOAA) and the U.S. Air Force. The primary weather sensor on the spacecraft is the Operational Linescan System (OLS), which provides the nighttime lights data used by Storeygard. First flown on DMSP satellites in 1976, the OLS is an oscillating scan radiometer with low-light visible and thermal infrared (TIR) imaging capabilities.
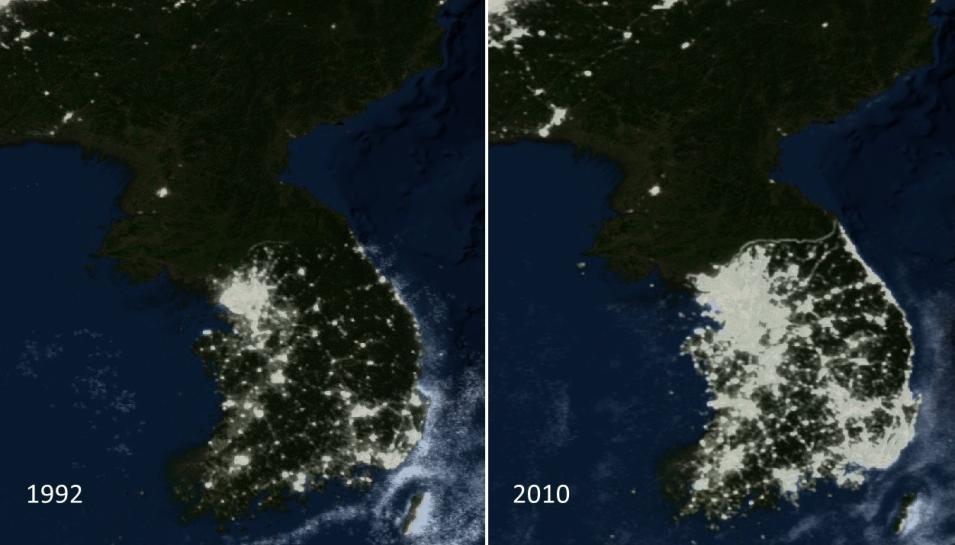
DMSP nighttime lights images from 1992 and 2010 showing changes in nighttime lights over the Korean Peninsula. The bright lights of South Korea contrast with the absence of lights in North Korea; also an increase in lights in clearly seen in South Korea over this time period.
Image Caption

Example of how nighttime lights imagery can be used to study growth over time and space. Both images were created from data collected by the DMSP-OLS series of satellites and show the Korean Peninsula. Note the high concentration of nighttime lights in South Korea vs. North Korea as well as the spread of lights over 18 years. The thin line stretching across the peninsula just north of the bright lights of Seoul, South Korea, is the Demilitarized Zone (DMZ) separating North Korea from South Korea. Lights over water are lights from fishing vessels, bioluminescence from ocean organisms, or off-gassing from oil wells. Both images: NOAA DMSP OLS Global Composites Version 4, National Centers for Environmental Information.

While previous work outside of economics noted correlations between the amount of light emitted by countries and traditional measures of their economic activity (such as GDP) in a given year or two, the research by Storeygard and his colleagues was the first to consider the relationship in changes in emitted light vs. GDP growth over time and analyze it in a formal statistical model. Having established the value of using nighttime lights data for quantitative economic analysis, Storeygard has used these data in numerous studies of urbanization and urban economic growth in sub-Saharan Africa, including studies into impacts of transport costs on a city’s economic growth and the effects of climate change on urbanization.

In a recent research project, Storeygard and his colleagues use nighttime lights data to help examine how attributes of physical geography, such as climate, topography, and proximity to coasts and navigable rivers, shape the location and density of human settlements worldwide. The research team notes that attributes related to agricultural productivity (such as a favorable climate and level terrain) are relatively more powerful in predicting settlement patterns within rich countries than attributes associated with trade access (such as proximity to water), which are relatively more predictive of settlement location within poor countries. This is somewhat surprising, Storeygard observes, because agriculture represents a much smaller share of overall employment and income in rich countries. It is, however, consistent with models representing how today’s rich, developed countries achieved the improvements in agricultural productivity prior to the 20th century that allowed them to urbanize at a time when transport costs were high.

Storeygard and his colleagues summarize that city sizes were limited by the ability of food to be transported to them, which, in turn, led to the development of a dispersed network of cities. By the time today’s poor countries began to urbanize rapidly in the mid- to late-20th century, transportation costs had fallen substantially, so their urban populations concentrated in a smaller set of cities in locations along coasts and navigable rivers. This research raises an intriguing speculative policy implication that cities of the developing world may be better located to thrive in today’s economy than if they had become organized much earlier into more dispersed city systems similar to those in richer regions like Europe and North America.

The integration of remotely-sensed satellite data with measurements of GDP and other traditional economic metrics was not on the minds of the ancient Greeks when they developed their concept of oikos. For Dr. Adam Storeygard, nighttime lights data, captured by sensors orbiting hundreds of kilometers above Earth, give him a unique resource to supplement traditional economic measurements—ecology being used for economy.

Representative data products used by Storeygard:

Daily nighttime lights data available through NASA:

  • Visible Infrared Imaging Radiometer Suite (VIIRS) Day/Night Band (DNB), Enhanced Near Constant Contrast; daily global imagery available through NASA’s Global Imagery Browse Services (GIBS) for viewing using NASA’s Worldview interactive data visualization application and similar applications

Read about the research:

Henderson, J.V., Squires, T., Storeygard, A. & Weil, D. (2017). The Global Distribution of Economic Activity: Nature, History, and the Role of Trade. The Quarterly Journal of Economics, 133(1): 357-406. doi:10.1093/qje/qjx030

Henderson, J.V., Storeygard, A. & Deichmann, U. (2017). Has climate change driven urbanization in Africa? Journal of Development Economics, 124: 60-82. doi:10.1016/j.jdeveco.2016.09.001

Storeygard, A. (2016). Farther on down the Road: Transport Costs, Trade, and Urban Growth in Sub-Saharan Africa. The Review of Economic Studies, 83(3): 1263-1295. doi:10.1093/restud/rdw020

Henderson, J.V., Storeygard, A. & Weil, D.N. (2012). Measuring Economic Growth from Outer Space. American Economic Review, 102(2): 994-1028. doi:10.1257/aer.102.2.994

Explore more Data User Profiles.

Details

Last Updated

Data Center/Project

Socioeconomic Data and Applications Center (SEDAC)