Dr. David Peterson

For meteorologist David Peterson, Ozone Mapping and Profiler Suite (OMPS) data are crucial for studying pyrocumulonimbus events.

Pyrocumulonimbus clouds—thunderstorms generated by wildfires—might seem like something out of science fiction, but they’re real, and seem to be occurring with greater frequency and intensity. For those who study aerosols—the solid particles, gasses, and liquid droplets suspended in the atmosphere—this is significant, as pyrocumulonimbus clouds can bring wildfire smoke and the particulates it contains to altitudes of 30,000 feet or higher.

Among the scientists interested in pyrocumulonimbus clouds and their ability to bring smoke to such lofty heights is Dr. David Peterson, a meteorologist with the Naval Research Laboratory’s (NRL) Marine Meteorology Division in Monterey, California. Peterson and his colleagues use satellite data and global aerosol models to monitor and track aerosols, including dust, pollution, sea salt, and smoke, that could impact Navy operations.

In the following interview, Peterson discusses the characteristics of pyrocumulonimbus (or pyroCb) events, the development and growth of the pyroCb research community, and how the study of pyroCb events would not be possible without the data from the Ozone Mapping and Profiler Suite (OMPS) instruments aboard the joint NASA/NOAA Suomi National Polar-orbiting Partnership (Suomi NPP) satellite and the Joint Polar Satellite System NOAA-20 and NOAA-21 satellites.

What is a pyroCb event?

A pyroCb event is a fire-generated thunderstorm. The abbreviation in weather for cumulonimbus is Cb, so by putting pyro in front of cumulonimbus, or Cb, you get pyrocumulonimbus or pyroCb. They're anchored directly to the fire such that the heat from the fire creates a bubble that helps trigger the development of a storm. Then the smoke that's released is fed straight up into the cloud. That's why we refer to these as giant chimneys—the smoke column is accelerated through the thunderstorm and released at whatever altitude the cloud reaches. That's at least 30,000 feet, but some of these extend into the stratosphere. We've seen smoke released from pyroCbs as high as 55 to 59 thousand feet.

One pyroCb event in British Columbia in 2017 changed the [pyroCb] community. A smoke plume from four or five pyroCbs was released into the stratosphere; at the time, it was one of the largest plumes ever seen at those altitudes, including plumes from volcanic eruptions. That plume travelled around the Northern Hemisphere and lasted eight months. It was the benchmark event. No one had ever seen anything like it. Then, in less than three years came the Australian fire season of 2019-2020. There was an outbreak of 38 pyroCb updrafts over the span of a few days that produced a plume roughly three times larger than the one from British Columbia. That plume travelled around the Southern Hemisphere and persisted for about 15 months.

This year, 2023, was [Canada's] worst fire season on record. It has also shattered our record for pyroCbs. Prior to 2023, 2021 was the most active year in Canada with 50 pyroCbs and 100 worldwide. This year Canada reached 50 pyroCbs by the third week of June. We're at 135 right now, so more than doubling 2021, and there have been 155 pyroCbs worldwide. Still, none of them by themselves have rivaled the stratospheric impact of Australia or the 2017 event in Canada.

You and your colleagues have been tracking the occurrence of pyroCbs for about a decade. What have you learned during that time?

Since 2013, we've been working to build the first pyroCb dataset for the globe; because the field is so new, you can't just go somewhere and download a record of pyroCbs. Our record is a little over a decade long now. That's not long enough to identify climate trends. What we do find, however, is that pyroCbs are fairly common and that they happen every year in certain regions of the globe. We generally expect to see around 40 or 50 events per year, meaning a fire that generates a pyroCb event. Previously, pyroCbs were considered to be phenomena that only occurred once in a while. We now know that's not true, that they happen every year, and we know a lot about the weather conditions that drive pyroCbs. That’s why they occur in specific regions.

Just because you have more wildfires doesn't necessarily mean you'll have more pyroCbs. You have to have a synergy of the right meteorological conditions and fire. In a region like Canada, you typically have both, but in other places, such as southern California in October, when you have the Santa Ana winds, that is not the right environment. Even though you can get very big devastating fires, they would not create pyroCb events. So, it depends on a couple of moving parts.

We've spent a lot of time on the weather aspect of pyroCbs at NRL. We wrote a paper that creates a conceptual model for what atmospheric conditions are required for a pyroCb event to occur. The fire, though, is something of a black box. We know they tend to be large and intense, but there are very few observations at the time pyroCbs occur to really quantify that. How large? How intense? What feedbacks are occurring? In the same way field measurements have helped us learn about tornado outbreaks, we need the same kind of information for pyroCbs to really understand what's going on.

Why are OMPS datasets so critical for monitoring and tracking smoke plumes from pyroCbs?

PyroCb smoke plumes have large quantities of light-absorbing aerosols and OMPS, with its UV wavelengths, is very good at picking up their signal. The primary OMPS product we use is called the ultraviolet aerosol index (UVAI). It's one of the primary tools we can use to track the movement of these plumes downwind. Plus, because it’s a global dataset, you can see the plume evolving day after day. Its also how we track a [plume's] magnitude. Higher values of the aerosol index generally means the plume is thick, dense, and at higher altitudes. We can also use it to capture the size of the plume by counting how many pixels it encompasses.
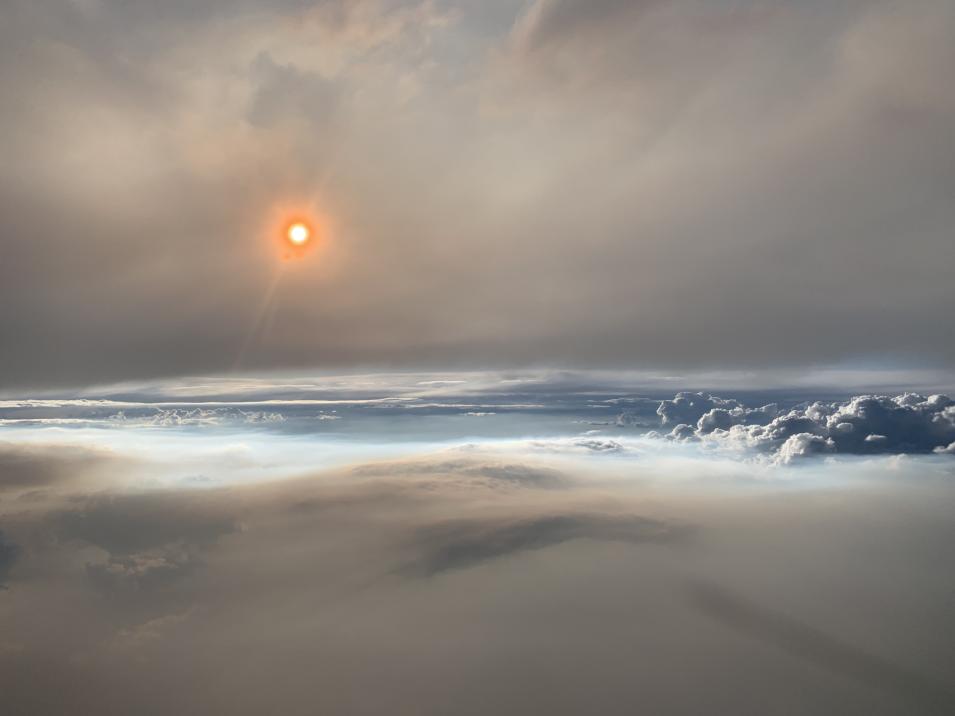
Peterson captured this image of the setting Sun shining through thick smoke at 8 p.m. Mountain Time while flying aboard a NASA DC-8 at an altitude of roughly 30,000 feet (9 kilometers). Particles in the smoke reflect light in ways that make the Sun appear orange. The photograph below shows the smoke plume (gray) that fed the pyrocumulonimbus cloud (white).
Image Caption

Peterson captured this image of the setting Sun shining through thick smoke at 8 p.m., Mountain Time, while flying aboard NASA's DC-8 research aircraft at an altitude of roughly 30,000 feet. Particles in the smoke reflect light in ways that make the Sun appear orange. The photograph shows the smoke plume (gray) that fed the pyroCb cloud (white). Image courtesy of David Peterson.

The most powerful way to use OMPS data, at least until recently, was in conjunction with spaceborne lidar. NASA's Cloud-Aerosol Lidar and Infrared Pathfinder Satellite Observation (CALIPSO) mission, which just ended, had a Cloud-Aerosol Lidar (laser) instrument that pointed down and provided vertical profiles of the atmosphere. So, during a pyroCb event, the lidar gave us the vertical depth of the plume and the UVAI gave us the overall expanse, and then we set a threshold in the aerosol index to identify just the part of the plume that we knew was in the stratosphere.

For our paper that compared the massive 2017 pyroCb event in British Columbia to the eruption of the Kasatochi Island volcano in 2008*, we were lucky in that [the OMPS and CALIPSO] observations came together. The day after the pyroCb event, there was an aerosol index value of 50. To put that in perspective if we get [an aerosol index value of] 10 it’s considered pretty high. Some of the bigger plumes have produced aerosol index values of maybe 15 to 20, so 50 was just off the charts. At the time, we had this blob of really high OMPS aerosol index with a CALIPSO orbit straight through the middle of it, so between the two products we were able to estimate the smoke mass (i.e., the mass of smoke particles that encompassed the plume), which gave us a value we could compare with data from the volcanic eruption. We could not have done this type of study without OMPS and vertical profiles from lidar.

In 2018, NASA's Land, Atmosphere Near real-time Capability for EOS (LANCE) released a near real-time (NRT) Level 2 OMPS Nadir Mapper Near UV Aerosol Index product for pyroCb events. How does it differ from the initial OMPS UVAI product and how is it used by the pyroCb community?

The [NRT product] is available in NASA Worldview. It’s the standard OMPS UAVI product, but it’s scaled knowing that high-altitude pyroCb smoke plumes produce these large aerosol index values, much larger than what you would get with other aerosol events. So, it allows you to be able to pick up on that unique signal.

In the community, there's the standard UVAI Product created by a team at NASA's Goddard Space Flight Center, the pyroCb scaled product, and then there’s the OMPS Limb-Profiler, which provides data on vertical aerosol distribution. Those three products are what the pyroCb community uses most from OMPS, as they all provide critical information to characterize pyroCb plumes.

Can you elaborate on how the pyroCb community uses these data products?

The number one thing is plume magnitude. Higher UVAI values mean there is a very thick smoke plume at high altitudes. The UVAI product also helps us follow where the pyroCb smoke plume is going over time. So, we can get a sense of its dimensions and how much area it covers, and then if you bring in data from the OMPS Limb Profiler and lidar you can get a sense of the plume’s vertical structure.

These products have allowed us to show that pyroCb smoke can rival the altitudes reached by volcanic eruptions. Through the UVAI, we know these smoke particles are absorbing solar radiation. That creates a heating effect in the plume. Once it's in the stratosphere it acts like a bubble, and if it holds together, it can keep rising steadily for weeks after the pyroCb event. It’s that second-order rising from the heating of the plume that allows the smoke to top out at these altitudes similar to a volcanic eruption. The aerosol cloud from the eruption of Mt. Pinatubo [in the Philippines on June 15, 1991] reached an altitude of 35 to 40 kilometers, which is well above the ozone layer. The smoke plume from Australian pyroCb events in 2019-2020 reached nearly 35 kilometers and, of course, the higher it reaches, the longer it takes to remove. That’s how you get a plume in the stratosphere with a 15-month lifespan. We wouldn't be able to see any of that without OMPS and lidar data. These tools are critical for those kinds of scientific discoveries and for day-to-day monitoring of the plumes.

Earlier, you mentioned that the satellite data from OMPS was also used to improve the NRL's models. How so?

First, there's the actual storm, so being able to predict when and where pyroCbs will develop and what fires are going to produce them. Then there are the downstream effects, which is mostly what we’ve been talking about. Currently we’re working in both areas. There are many different pieces involved in being able to build a full prediction capability for pyroCbs, both in regard to the development of the storm and its downstream effects. It involves weather data for the pyroCb prediction and the use of satellite data to determine how we would build a pyroCb source into an aerosol model. So, that’s where we're heading. It's still a ways down the road.

This blue marble-type image of Earth's Southern Hemisphere from NOAA's GOES-17 satellite shows a smoke plume generated by several pyroCbs that occurred during the 2020 Australian fire season. Visible in the image are red arrows pointing to the locations of Australia, New Zealand, clouds, and the ocean.
Image Caption

The Australian fire season of 2019-2020 produced 38 pyroCb updrafts over the span of a few days that produced a plume roughly three times larger than the one from British Columbia in 2017. The Australian plume, which can be seen as grayish streaks in this January 2, 2020, true-color image from NOAA's GOES-17 satellite, travelled around the Southern Hemisphere and persisted for about 15 months. Image courtesy of David Peterson.

The big missing piece is direct observations from aircraft. Anyone who simulates pyroCb smoke, and there have been a handful of studies now trying to simulate these big events, have had to make a ton of assumptions about the size and composition of the smoke particles. Satellites can only give you so much information, which is why you need the direct measurements. These would also supplement OMPS data, because with direct measurements you would be able to constrain the factors influencing the UVAI values linked to these unique smoke plumes.

Why are pyroCbs of interest to the Navy and the NRL?

PyroCbs are not included in any of the smoke transport models used operationally. [This means] forecasters can’t account for significant smoke release at aircraft cruising altitudes and rapid transport [of smoke] downwind by the jet stream.

This year (2023) in Canada was a prime example of why we need to get this right. We had fires burning from coast-to-coast, and depending on the altitude, the smoke was going to different places. PyroCbs were a big part of that. During the hazardous air quality event in early June, the smoke that impacted U.S. cities was coming from fires in Quebec. There were layers of smoke above that came from western Canada and some of that was delivered through pyroCbs. Then, above that in the lower stratosphere, there was a thin layer of smoke that had already gone around the globe once from pyroCbs that occurred in early May.

The point here is that trying to forecast all those smoke layers at the right altitude is incredibly challenging. That's one of the areas the Navy would like to improve. By improving smoke sources at different altitudes, you can better understand potential impacts on downstream meteorology.

___________________________

* Note: The paper by Peterson and his colleagues found that, "the mass of smoke aerosol particles injected into the lower stratosphere from five near-simultaneous intense pyroCbs occurring in western North America on 12 August 2017 was comparable to that of a moderate volcanic eruption, and an order of magnitude larger than previous benchmarks for extreme pyroCb activity."

Details

Last Updated