NASA’s Atmospheric Science Data Center (ASDC) has a redesigned website to better serve the needs of the atmospheric science data community. Along with making it easier to search for data, new educational features provide a wealth of opportunities for learning more about atmospheric data.
Located at NASA’s Langley Research Center in Hampton, Virginia, ASDC is the discipline-specific Distributed Active Archive Center (DAAC) responsible for data related to aerosols, clouds, radiation budget, and tropospheric composition in NASA’s Earth Observing System Data and Information System (EOSDIS) collection. A lot of time and research went into making sure that the updated website will be a great experience for users and provide resources to enable users to more efficiently use data and services.

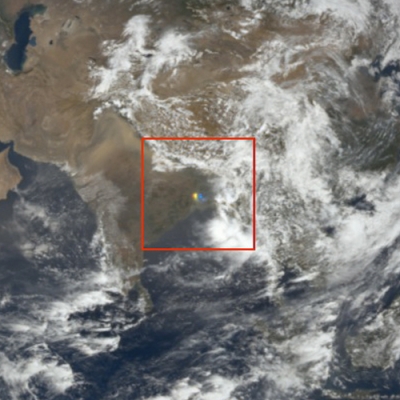
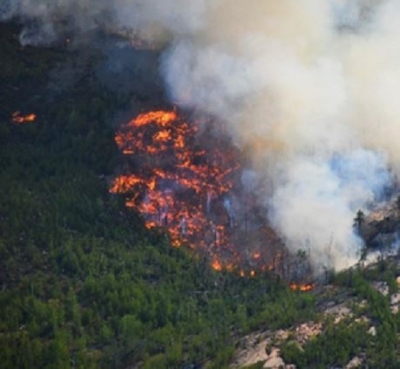
In addition to making data easily searchable, the website also aims to be a hub for education and outreach through the efforts of ASDC’s Science Outreach Team. The goal of this recently formed team is to de-mystify atmospheric science data and inspire people to use these data in new, innovative ways. For example, a microarticle and Jupyter Notebook about the Australian wildfires were recently published on the new website. The microarticle introduces the topic and datasets while the attached Jupyter Notebook contains Python code users can run on their own computer to reproduce a gif that uses aerosol optical depth (AOD) data from the Multi-angle Imaging Spectroradiometer (MISR) instrument aboard NASA’s Terra satellite. The Jupyter Notebook also acts as a template, enabling users to easily change the datasets or dates to suit their needs.
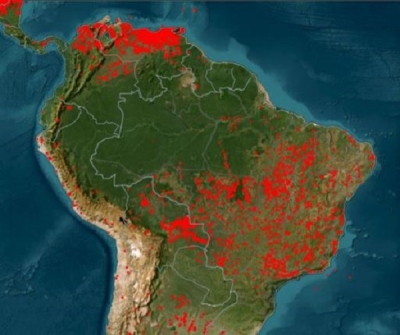
The ASDC Science Outreach Team is also developing new ways to tell stories using atmospheric science data through the use of Esri ArcGIS Story Maps. Story Maps allow users to interact with a compelling narrative through data-driven maps, videos, and charts. In addition, Story Maps can help train people in using the data and serve as inspirational tools to showcase the possibilities for visualizing data. The Science Outreach Team recently made a Story Map on Arctic wildfires.
Several other upcoming projects will be available through the updated website. The ASDC Geographic Information System (GIS) team has been researching innovative ways to use Esri’s ArcGIS software to visualize and interact with atmospheric data, and airborne data users will have access to the new Sub-Orbital Order Tool (SOOT) that will enable users to easily search for and download gas and aerosol data.
NASA ASDC’s updated website makes it easier than ever to find the atmospheric science data and educational resources you need. Check it out!
Explore the NASA ASDC website: https://asdc.larc.nasa.gov/