“Most kids don’t have good spatial awareness; it’s something that has to be taught,” says Balani’s teacher Natalie Macke. Macke has used My NASA Data resources with her advanced placement and college prep environmental science and her honors and college prep chemistry students for more than six years at Pascack Hills High School. “Spatial context is really difficult for these kids because they don’t have as much experience interpreting models of data, understanding the limitations of that interpretation, and then thinking if there is a context for the reason why a particular model was chosen and if there are limitations to the model.”
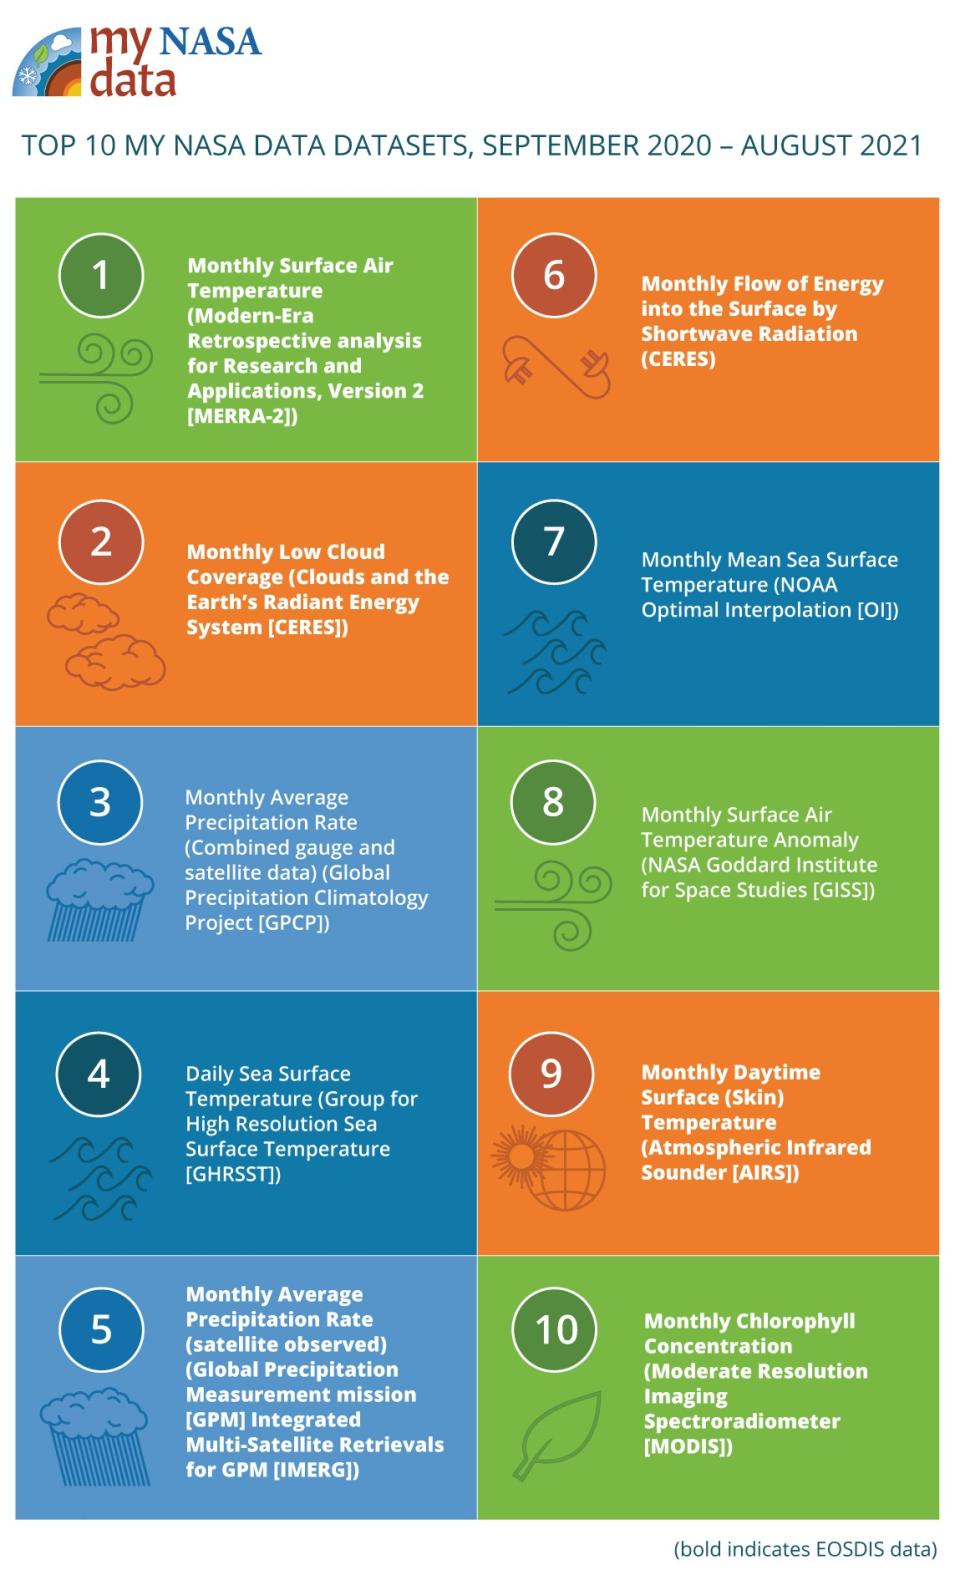
My NASA Data resources include lesson plans, mini lessons, story maps, data visualizations, and even a data search tool designed specifically for students. Data are arranged by sphere (atmosphere, biosphere, geosphere, hydrosphere, cryosphere), with a special section (Earth As a System) showing how these spheres are interrelated. The EOSDIS data included in the resources are mainly processed Level 2 and Level 3 data (rather than raw satellite data) since these products are more easily integrated into the My NASA Data Earth System Data Explorer tool, which relies on gridded global and regional data.
“We prefer data that have global coverage or at least cover North America and the United States,” says Dr. Brad Hegyi, the My NASA Data Earth system data advisor. “We need gridded data that are in the right format [NetCDF] and that help reveal scientifically important patterns in the data. We also prefer data that cover a long time range – years to decades – and that originate from the most current mission measuring that variable.”
In his data advisor role, Hegyi identifies data that can be incorporated into My NASA Data resources and reviews scientific literature to see how scientists are using the data to describe specific phenomena. He then curates the data with the My NASA Data team to ensure teachers can easily find the best data to feature in their lessons about a particular phenomenon.
The My NASA Data team does not work alone, though. A nationwide network of product reviewers and key stakeholders provide input and test products before these resources reach students. Product reviewers are generally active teachers, like Macke, who test products to identify potential issues and logistical hurdles, such as the time a lesson plan takes to implement, the amount of color used (since this might require costly color copies), or the formats in which data are presented.
“It’s one thing to write a lesson; it’s something else to actually do the lesson,” says Macke. “The [My NASA Data] team can take our suggestions and put together some solutions to make things more accessible by changing how information is presented or giving some additional information that was missing in terms of context.”
Along with product reviewers, key stakeholders also provide valuable input. These are individuals who provide professional development to teachers or who coordinate curricula for school districts. As My NASA Data PI Taylor points out, this group provides the big picture perspective of what’s going on in science education and with data literacy in classrooms.
My NASA Data is predominately funded by NASA’s Science Activation Program through an award called GLOBE Mission Earth, and Taylor sees My NASA Data as complementary to the Global Learning and Observation to Benefit the Environment (GLOBE) Program. GLOBE provides students with hands-on experience collecting data at the local level, such as weather observations, tree height measurements, and soil observations. These activities enable students to see the data they collect as a dataset as they learn how to analyze these local data. Students can then take the data literacy gained from this foundational experience to the next level – analyzing and working with data they did not collect, such as remotely sensed NASA Earth observing data.
As Taylor explains, My NASA Data resources teach students how to use NASA data to gain a global perspective of what they should expect to see in their local data. “GLOBE provides the [data collection] experience; it provides the localization – my place, my location,” she says. “Then we add on My NASA Data to extend this local data to a regional or global scale.”
As a student new to using Earth observing data, Balani appreciates the chance to work with NASA data. “Sometimes you don’t even realize that you can have access to these [data],” she says. “You feel like it’s more for people like scientists and other professionals. To know we have access to [these data] as high school students is pretty cool.”


