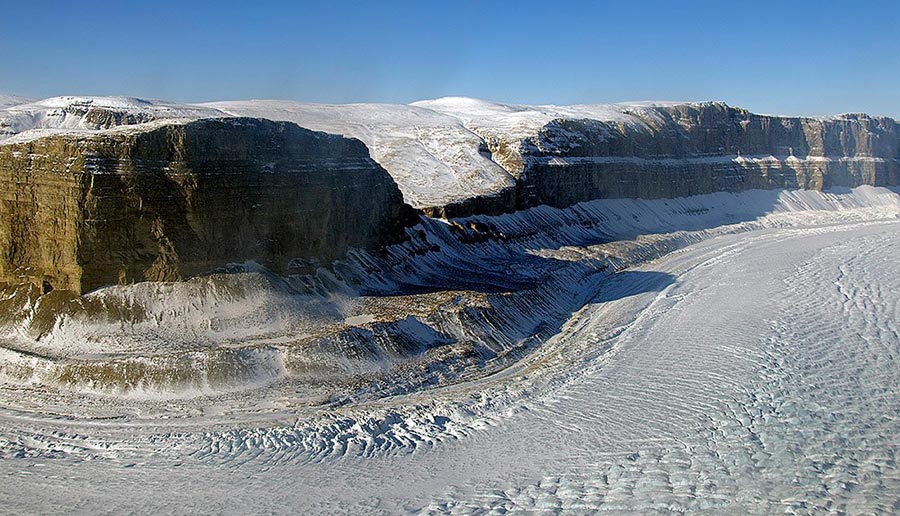
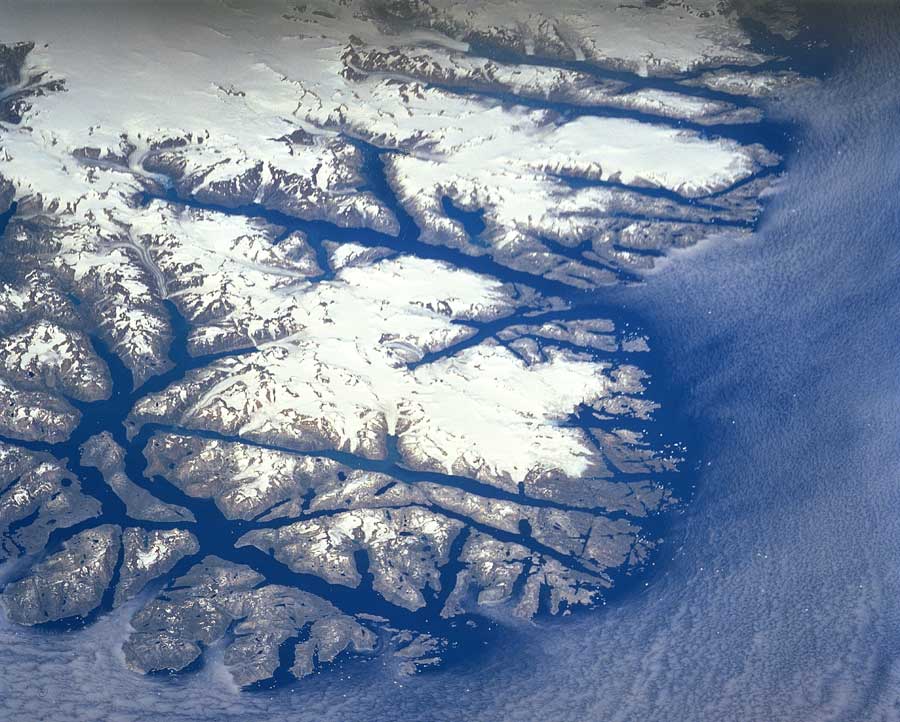
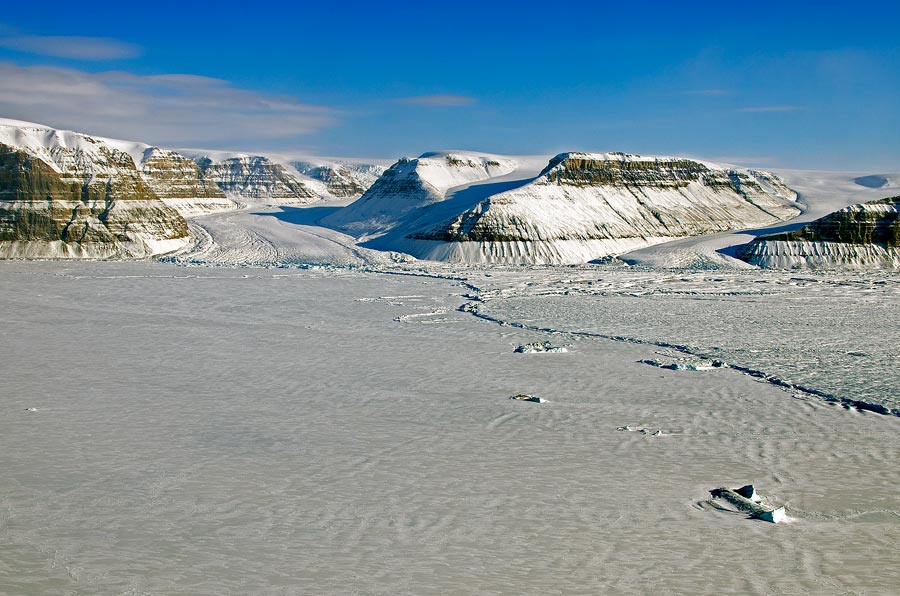
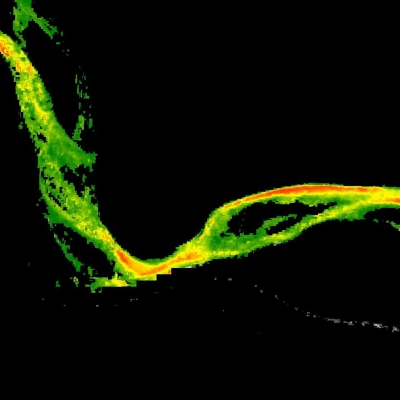
On the world’s largest island sits the second largest body of ice. In summer, the ice heads for the ocean as the sun’s warmth melts the Greenland Ice Sheet surface in turquoise-blue ponds. Meltwater percolates through pocks and out into rushing streams. In the green fjords ringing the coast, slabs of ice plunge off glacier fronts, pushed out by the slow flow of glaciers that serve as major outlets for ice discharge.
A warmer planet is tipping the balance between ice accumulation and loss in Greenland. Showy, fast-moving Jakobshavn Glacier was filmed spectacularly calving 1.8 cubic miles of ice in 2012, and is thought to have calved the iceberg that sunk the Titanic. Less showy glaciers like Upernavik Glacier may be hiding secrets about the ice sheet’s future. Researchers such as ice sheet modeler Mathieu Morlighem are peering beneath glaciers to the bedrock below and overturning assumptions about how the Greenland Ice Sheet may respond to a warmer climate.
A glacier’s journey
More than 100,000 years old and up to two miles thick, the ice sheet has been waning in recent decades. It contains enough ice to raise sea levels twenty-four feet, if all of it melted.
If warmth is the accelerator pedal, topography can be the brakes. Greenland has more than 200 valleys and canyons, which channel glacier ice from the island’s high interior to its coasts. Glaciers move slowly in twisting valleys, and faster in straight valleys. However, the glaciers’ ice mostly hides the terrain that influences this flow.
When the base of the glacier, or its grounding point, is below sea level when it reaches the coast, the ice can contact a layer of warm Atlantic water a thousand feet below the surface, speeding ice discharge. But how many of these valley floors are below the ocean surface, and for what distance upstream? The data at hand portrayed Greenland’s valleys as shallow.
“Lots of people used to say that the Greenland Ice Sheet is not so vulnerable to climate change, because once the glaciers retreat inland about ten kilometers [six miles], they will not be connected to the ocean, and so the melting we see today will stop,” Morlighem said. There, the elevation of the valley floor would rise above sea level and stop the ocean from following a glacier up the valley. However, researchers knew that something was amiss when ice sheet models were not able to simulate current rates of melting and ice sheet thinning.
Stop kriging the bed
Morlighem builds ice sheet models, which use data to simulate how the ice sheet will respond to environmental change. He admits that he is standing on the shoulders of Jonathan Bamber at University of Bristol. Since the 1990s, Bamber has used airborne radar to study the geometry of Greenland’s glacier valleys. In 2013, Bamber’s team compiled thousands of miles of ice-penetrating radar flightlines collected over the ice sheet as part of NASA's Operation IceBridge. They produced a bedrock elevation data set for Greenland, extending out to the continental shelves.
As they compiled the data, they discovered a huge canyon running from the central region of the island northward to the fjord of Petermann Glacier and the Arctic Ocean. Dubbed “Greenland’s Grand Canyon,” it is more than 750 kilometers long (466 miles), up to 800 meters deep (2,600 feet), and 10 kilometers wide (6 miles), making it the longest canyon discovered on Earth. They think the canyon is a major channel for flushing ice and meltwater off the island. Without canyons like this, meltwater might pool under the ice sheet and form subglacial lakes, as are found under the ice sheet on Antarctica. Greenland has no lakes below its ice sheet.
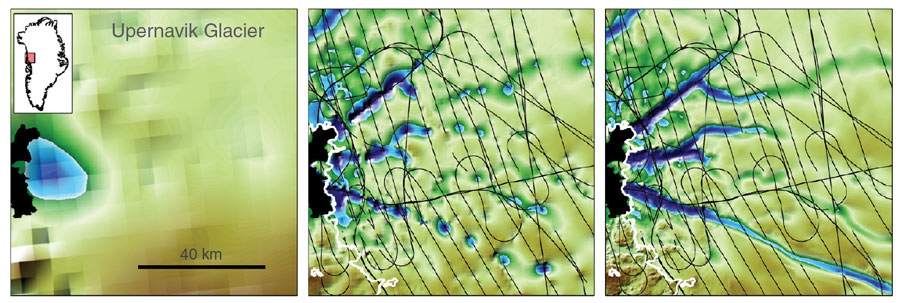
Still, important questions hung in the air, and radar data were too sparse to answer them. “Originally the bed topography map was derived from data collected along flight lines from Operation IceBridge. These were point measurements. In between we have nothing,” Morlighem said. “People used kriging, a kind of clever averaging where you look at neighboring data.” With too-sparse observations, however, kriging tended to smooth out and eliminate directional land features, like valleys and troughs, so the models could not accurately simulate ice thickness and velocity.
“So the previous maps we were using were not good enough to run the models at a higher resolution,” Morlighem said. In addition, crevasses, rough terrain, and pockets of liquid water all confuse the radar, foiling attempts to interpolate the sparse measurements. “We had to devise a new method,” he said.
A zero sum game
Eric Rignot at University of California, Irvine, who worked on the study, said, “We’ve struggled with the problem of not having glacier thickness for a number of years. I encouraged Mathieu to go with a more modern, powerful version of a mass conservation method of calculating thickness.” Mass conservation assumes that mass is never lost, but accounts for inputs and outputs, such as snow accumulation, ice velocity, and melt. To get the ice volume, you need to know how thick it is, and to calculate thickness you need the elevation of the ice surface and of the ice bottom, on the rock. The bottom elevation would also tell how far the ocean would be able to reach up the glacier stream as it retreated. Some of this detail was lacking.
Morlighem’s team used the mass conservation approach to back into the bed elevation detail. They combined the sparse airborne data with high-resolution ice motion data from satellite Interferometric Synthetic Aperture Radar (InSAR). They could then calculate ice thickness more accurately by accounting for ice velocity. Bed topography could be deduced by subtracting ice thickness from a digital elevation model of the ice surface.
Their results show the widespread presence of well-eroded, deep bed troughs along the edges of the ice sheet that are generally grounded below sea level, with fast-flowing ice. They extend more than 100 kilometers (62 miles) inland, not the 10 kilometers (6.2 miles) that had been thought. The full extent of some of these bed troughs had never been detected by previous radar sounders.
Bamber said, “The work that Mathieu and that group are doing is fantastic. It tackles one of the problems that we knew existed. Mathieu is working on the problems around the ice sheet’s edge. It wouldn’t work in the ice sheet’s interior and where you don’t have this clear directional flow.”
Deeply incised
Fast-moving Greenland glaciers such as Jakobshavn Glacier remain important channels for ice discharge. Yet this new view of deep, submarine valleys sheds a different light on the long-term decline of the ice sheet.
“In many places we thought that the bed was raised above sea level but it was below sea level,” Morlighem said. For the first time, for example, they could see that the bed of the three main branches of Upernavik Glacier in West Greenland runs below sea level for more than 80 to 140 kilometers (50 to 87 miles) inland. Up north, Humboldt Glacier’s submarine bed runs 140 kilometers (87 miles) inland. Morlighem said, “We now know that the melting of Greenland is not going to stop in a decade or so. It will keep melting. As the ice retreats, it will still be in contact with the ocean because it will follow it inland.”
The original radar data and the new bedrock data set are both archived at NASA's National Snow and Ice Data Center (NSIDC) Distributed Active Archive Center (DAAC) for further study. “All these efforts will eventually lead to modern data sets for the ice sheets and provide what modelers need to project ice sheets in a warming world. These are critical and timely results,” Rignot said. “The submarine valleys make the glaciers more susceptible to rapid, prolonged retreat. It’s a game changer for sea level. Sea level rise from Greenland will be higher than models currently project.”
References
ALOS PALSAR data 2008-2009 (JAXA, METI). Retrieved from NASA's Alaska Satellite Facility (ASF) Distributed Active Archive Center (DAAC), https://www.asf.alaska.edu.
Bamber, J. L., J. A. Griggs, R. T. W. L. Hurkmans, J. A. Dowdeswell, S. P. Gogineni, I. Howat, J. Mouginot, J. Paden, S. Palmer, E. Rignot, and D. Steinhage. 2013. A new bed elevation dataset for Greenland. The Cryosphere 7: 499–510, doi:10.5194/tc-7-499-2013.
Bamber, J. L., M. J. Siegert, J. A. Griggs, S. J. Marshall, and G. Spada. 2013. Paleofluvial mega-canyon beneath the central Greenland Ice Sheet. Science 341(6149): 997–999, doi:10.1126/science.1239794.
Leuschen, C., P. Gogineni, F. Rodriguez-Morales, J. Paden, and C. Allen. 2010, updated 2015. IceBridge MCoRDS L2 Ice Thickness. Boulder, CO, USA. National Snow and Ice Data Center (NSIDC) DAAC. doi:10.5067/GDQ0CUCVTE2Q.
Morlighem, M., E. Rignot, J. Mouginot, H. Seroussi, and E. Larour. 2014. Deeply incised submarine glacial valleys beneath the Greenland ice sheet. Nature Geoscience 7: 418–422, doi:10.1038/ngeo2167.
Morlighem, M., E. Rignot, J. Mouginot, H. Seroussi, and E. Larour. 2015. IceBridge BedMachine Greenland. Version 2. Boulder, CO, USA: National Snow and Ice Data Center (NSIDC) DAAC. doi:10.5067/AD7B0HQNSJ29.
RADARSAT-1 data 2008-2009 (CSA). Retrieved from NASA's Alaska Satellite Facility (ASF) DAAC, https://www.asf.alaska.edu.
For more information
NASA Alaska Satellite Facility Distributed Active Archive Center (ASF DAAC)
NASA National Snow and Ice Data Center DAAC (NSIDC DAAC)
| About the data | |||||
| Satellites | Canadian Space Agency RADARSAT-1 | Japan Aerospace Exploration Agency (JAXA) Advanced Land Observing Satellite (ALOS) | |||
| Platforms | Douglas DC-8, Lockheed P-3B Orion | ||||
| Sensors | Multichannel Coherent Radar Depth Sounder (MCorDS) | Synthetic Aperture Radar (SAR) | Phased Array type L-Band Synthetic Aperture Radar (PALSAR) | ||
| Data sets | IceBridge MCoRDS L2 Ice Thickness | RADARSAT-1 Level 0 Data | ALOS PALSAR Level 1.0 Data | ||
| Resolution | 17.8 to 965 meters | 8 to 100 meters | 100 to 250 meters | ||
| Parameters | Ice sheet elevations Ice sheet thickness |
Reflectance | Reflectance | ||
| DAACs | NASA National Snow and Ice Data Center Distributed Active Archive Center (NSIDC DAAC) | NASA Alaska Satellite Facility DAAC (ASF DAAC) | NASA ASF DAAC | ||
