Before the sun rises, members of the Icot people set out fishing kites in Mexico’s Gulf of Tehuantepec (teh-wahn-teh-pek). Offshore, five-foot nylon kites rise quickly, anchored by buckets of stones and tethered to nets sousing in freaky, ten-foot waves. These winter waters turn violent with the squally Tehuano wind. It can blow without warning on a clear day, packing gale- or hurricane-force winds. The kites fly all night as strong winds upwell colder, nutrient-rich water. Icot fishermen return the next day to a bounty of fish, more than 600 pounds without setting foot in the turbulent waters.
Scientists want to decode the Tehuano’s unpredictable and violent nature to keep mariners safe. But they are also curious about the wind’s relationship with other processes, big and small. Does the Tehuano cause the upwelling, for example, or is it caused by something else? Is it just a local weather event, or does it contribute to that complicated, global climate soup? More importantly, can the Tehuano be predicted?
Deborah K. Smith, a geographer and remote sensing expert, is part of a team eager to build a climatology for the Tehuano: wind and sea surface temperature measurements of the event spanning many years. Climatologies power global climate models and weather forecasts. They average weather statistics accumulated over many years. “We faced a massive amount of data,” Smith said. To succeed, a computer algorithm would need to know when a Tehuano was present.

The gap
Smith and her colleagues have never been to the Gulf of Tehuantepec. They worked exclusively with remote sensing data, exchanging e-mails and conducting phone conferences from Santa Rosa, California with Smith’s colleagues at the University of Alabama in Huntsville (UAH). Unfortunately, weather instruments in the study area are scarce. “Over land there are plenty of wind anemometers. In the ocean, there are very few,” Smith said. “The only place you would put an anemometer is on a ship or on a buoy, and we only have so many of those out there.”
For Ken Keiser, who leads the algorithm development team, and primary developer Xiang Li, both at UAH, the biggest challenge was getting to know the Tehuano itself. “I needed to fully understand the physical properties of the Tehuano and the ocean upwelling to write the algorithm that identifies these features,” Keiser said.
The researchers traced the Tehuano’s genesis in North America, where cold outbreaks over the Great Plains trigger air pressure differences that flow southward to eastern Mexico and the Bay of Campeche. The winds funnel through the Chivela Pass, a narrow gap in the Sierra Madre Mountains. This forces the winds to accelerate, much like air hisses out of a tire leak. The winds emerge as a wind jet with speeds in excess of 20 meters per second (45 miles per hour). For this reason, scientists call the Tehuano a coastal gap wind jet, or simply gap wind.

The Tehuano can extend hundreds of kilometers out into the Gulf of Tehuantepec and beyond into the Pacific Ocean. On the water, it causes a big drop in sea surface temperature. “The wind pushes the surface water away,” Smith said. “That causes cold water to come up and create really good fishing areas.” Seasoned boaters know it is the Tehuano when waves crash away from the shore instead of toward it.
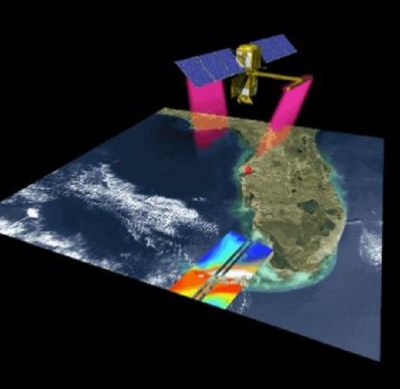
Smith and her colleagues looked at ocean surface wind and sea surface temperature data from NASA's Physical Oceanography Distributed Active Archive Center (PO.DAAC) to extract all the Tehuano events in the data series. But it would have taken them years to sort the satellite images manually. “The human eye can pick out the Tehuano immediately,” Smith said. “That’s difficult to do in an automated fashion. The challenge was to develop code that can do what the human eye can do.”
A tongue of wind
“The Tehuano comes from the land out to sea and it looks a lot like a channel of very high winds with much weaker winds on either side,” Smith said. The wind vector image of the Tehuano is peppered with tiny arrows that indicate wind direction, and the waters off eastern Mexico, Texas, and Florida are full of arrows pointing south. Warm colors indicate high wind speed, and it is orange and yellow all over these waters. Then, just south of the Isthmus of Tehuantepec where North America ends and Central America begins, arrows spew southward and westward, over intense red and fuchsia shades. It looks like southern Mexico grew a tongue and is licking the Pacific Ocean.
The UAH team developed an algorithm to recognize this, and then sent Smith a test batch of detected Tehuano events. “I would compare their list to my own visual observation,” Smith said. “We iterated back and forth quite a bit.” The algorithm’s goal was to identify the Tehuano’s extent, when it started and when it ended. It also recorded wind statistics, like maximum speed, mean and standard deviation of the wind speeds and wind directions, and mean latitude and longitude of the detected region.
“The hard part wasn’t identifying the strong days,” Smith said. “It was the weaker days. What was the start or the end? When was it weakening or strengthening? How do you identify those in a satellite image?”
To solve this, the team labored over pixel by ambiguous pixel. “Sometimes you see a red pixel and then a yellow again which means slower wind speed,” Smith said. “That tricks the algorithm into thinking that it’s the edge of the gap wind.” It could be something natural slowing the wind, or it could be a satellite issue.
It took three years of back and forth work between the colleagues, and when they finished they had a thirteen-year climatology for the Tehuano and two smaller gap winds in the nearby gulfs of Papagayo and Panama. The climatologies, called Regional Air-Sea Interactions (RASI), span 1998 to 2011 and are archived at and distributed by NASA's Global Hydrometeorology Resource Center (GHRC) DAAC. The center also hosts a RASI exploration tool, which allows users to locate gap winds and ocean upwellings, and to visualize, plot and download the data.

The name of the wind
It is not just Central America that benefits from this algorithm. Other parts of the world could adapt it to build climatologies for their gap winds. The Mistral, for example, funnels through the valley of Rhone in southern France into the Mediterranean Sea. In Switzerland, there is the Jochwinde. In Greenland, there is the tip jet at the island’s southern end.
Mariners and pilots turn to global models for information about when these gap winds might happen. Smith said global models just do not have enough resolution for that. “The physics for these models are designed for larger-scale things, not these small scale regional features,” Smith said. Global models have a one degree resolution. The RASI climatology zooms into a quarter degree—just right for regional forecasts.
Emily Foshee, a graduate student at UAH, is now using the climatologies to develop a method to forecast the Tehuano, Papagayo, and Panama gap winds. The climatologies also promise to shed light on bigger puzzles. Keiser said, “The same tech we use to identify these features can be applied to hurricanes. The upwelling that gap winds cause can influence how hurricanes strengthen.” It might take some finagling, but the algorithm might help global models improve hurricane intensification forecasts.
To Smith, being able to study patterns in these climatologies is a powerful tool. “That’s where the RASI comes in. You can see the patterns,” she said. “Are they changing with global climate change and if so, have they started or ended earlier in the season? These questions can be explored because we now have this information. That’s very exciting.”
References
Li, X. and D. Smith. 2014. Regional Air-Sea Interaction (RASI) Gap Wind and Coastal Upwelling Events Climatology [indicate sites used]. Data sets available online [ftp://ghrc.nsstc.nasa.gov/pub/rasi/] from the NASA EOSDIS Global Hydrometeorology Resource Center Distributed Active Archive Center (GHRC DAAC) Huntsville, AL, U.S.A. doi:10.5067/MEASURES/RASI/DATA404.
NASA/GSFC/NOAA. 2009. Cross-Calibrated Multi-Platform Ocean Surface Wind Vector L3.0 First-Look Analyses. Ver. 1. PO.DAAC, CA, USA. doi:10.5067/CCF30-01XXX.
Ornelas, C. 2008. Adrift in el Istmo: a Kite Journey to Juchitán. Discourse: from the end of the line 1(3): 23–30. http://www.drachen.org/sites/default/files/pdf/Discourse%20Issue%203.pdf.
Remote Sensing Systems. 2011. GHRSST Level 2P Gridded Global Subskin Sea Surface Temperature from WindSat polarimetric radiometer on the Coriolis satellite. Ver. 7.0. PO.DAAC, CA, USA. doi:10.5067/GHWST-2GR01.
Remote Sensing Systems. 2011. AMSR-E Level 3 Sea Surface Temperature for Climate Model Comparison. Ver. 1. PO.DAAC, CA, USA.
Remote Sensing Systems. 2004. GHRSST Level 2P Global Subskin Sea Surface Temperature (SST) from the Tropical Rainfall Mapping Mission (TRMM) Microwave Imager (TMI). Ver. 4.0. PO.DAAC, CA, USA. doi:10.5067/GHTMI-2PR01.
Smith, D. K., X. Li, K. Keiser, and S. Flynn. 2014. Regional Air-Sea Interactions (RASI) climatology for Central America coastal gap wind and upwelling events. Paper presented at the OCEANS 2014 Marine Technology Society/Institute of Electrical and Electronics Engineers (IEEE) Conference, St. John, Newfoundland. doi:10.1109/OCEANS.2014.7003127.
For more information
NASA Global Hydrometeorology Resource Center Distributed Active Archive Center (GHRC DAAC)
NASA Physical Oceanography DAAC (PO.DAAC)
| About the data | |||||
| Satellites or tools | Various | Various | Regional Air-Sea Interaction (RASI) Gap Wind and Coastal Upwelling Events Climatology | ||
| Sensors | Various | Various | |||
| Data sets | Cross-Calibrated Multi-Platform (CCMP) Ocean Surface Wind Vector L3.0 First-Look Analysis | L2P Gridded Global Subskin Sea Surface Temperature |
Gulf of Panama, Panama |
||
| Resolution | 0.25 degree x 0.25 degree | 0.25 degree x 0.25 degree | 0.25 degree x 0.25 degree | ||
| Parameters | Ocean surface winds | Sea surface temperature | Ocean surface winds, sea surface temperature | ||
| DAACs | NASA Physical Oceanography Distributed Active Archive Center (PO.DAAC) | NASA PO.DAAC | NASA Global Hydrometeorology Resource Center Distributed Active Archive Center (GHRC DAAC) | ||