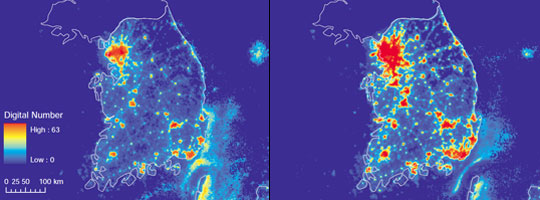
They say that New York City never sleeps. Even at three in the morning, subway cars trundle through dark tunnels, cabs zip across surface streets, and the city glitters with streetlights and brightly lit billboards. In a satellite image of the United States at night, New York City shines brighter than anywhere else on the continent.
It is no coincidence that New York City is also one of the top economic centers in the world. Economists first connected economic activity with night lights when the U.S. Department of Defense released satellite images of worldwide lights in the 1970s. Adam Storeygard, an economist at Tufts University, said, “When the satellite lights data were declassified in the 1970s, researchers published papers showing pictures of lights, and how they correspond to human settlement and economic activity.”
But while the data were an interesting tidbit thirty years ago, nobody thought to harness them to look at serious economic questions. Now Storeygard and Brown University economists Vernon Henderson and David Weil have turned those pretty nighttime satellite pictures into a unique measure for economic growth, allowing them to fill in data gaps and answer questions that have traditionally stumped economists.
Measuring production
Normally, when economists talk about economic growth, they use a measure called Gross Domestic Product (GDP), an index that measures the value of all the goods and services in a country’s economy. Essentially, GDP is a score that tells economists how a country’s economy is faring with respect to other countries, and how it is growing or declining. To calculate a country’s GDP, Weil explained, researchers need a lot of data, including an accounting of all of the goods and services produced in a country, and the prices people paid for them.
“In a developed, corporatized, organized economy those numbers are at least in principle observable,” said Weil. “There are problems, but you can do an okay job.” But in developing countries, it is harder to get enough data to accurately estimate GDP - a fact well recognized by economists and the organizations that track GDP. Weil said, “There are estimates of GDP for every country in the whole world. There are also grades corresponding to how accurate these estimates are thought to be. Rich countries get an A, while poor countries might get a D.”
The problem with getting good GDP data is that in poor countries, much economic activity does not get recorded in official measures. People might hide their business from the government to avoid taxes, or they might be bartering for goods and services, in ways that the government does not track. That makes it difficult to estimate the true GDP, which in turn makes it difficult for economists to analyze what is going on economically in poor countries, and whether new development policies are working or not.
The lights go on
Although researchers in the 1970s had established that city lights were linked to economic activity, they had not gone very far beyond that basic observation. The data series was short, and the correlation between lights and economic activity was rather rough. Storeygard said, “There are other reasons why you might have more lights in one area than another. For example, even if they have the same level of economic activity, you might have more lights in Las Vegas than you would in Salt Lake City.”
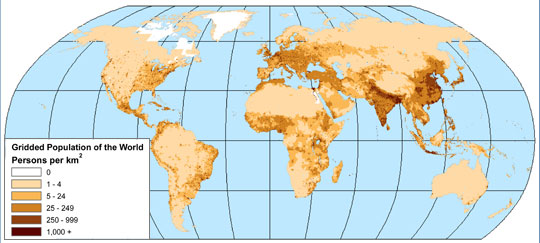
Storeygard, Weil, and Henderson decided to look at changes over time, focusing on the growth or decline in one area, instead of comparisons between locations. They also aligned the data on lights with population data from NASA's Socioeconomic Data and Applications Center (SEDAC) to determine the location of large cities and to define land area and data coverage. Most census data, like economic data, are organized by country or county—artificial boundaries that satellites do not recognize. In contrast, the SEDAC population data are tied to a geographic grid, making them easy to relate to satellite data. Storeygard said, “The SEDAC data are a useful intersection point between natural sciences data and population data.”
The resulting lights data showed a clear correlation with economic activity, although they were not as accurate as standard GDP data. “We don’t think that lights data give us a better estimate than what we currently have, but we think that it gives us a different estimate,” Weil said.
The researchers combined their lights-based estimate of economic activity with traditional GDP data to get an even better measure. “Two uncorrelated measures are better than one,” Storeygard said. Because the errors in the two data types came from different sources, he said, a combined indicator reduced the overall error.
The lights data also have a few other advantages. First, lights data are available worldwide, and are no less accurate in poor nations than in rich countries. Storeygard said, “The lights data are even available for places like North Korea that don’t report traditional economic data.”
Secondly, lights data are geographical, not national, so they allowed the researchers to look more closely at particular regions within countries where previously the only data were nationwide. Weil said, “To a large extent economics has been restricted to looking at countries, because that is the unit from which the data have come. These lights data give us, albeit imperfectly, data at much smaller scale.”
New perspective on production
Researchers can now start to tackle difficult questions that have long challenged them. In a 2012 study, Weil, Henderson, and Storeygard asked several questions about economic growth in Sub-Saharan Africa, a region with particularly bad economic data. First, they wondered whether economies in coastal regions were growing faster than those in land-locked areas. Because coastal cities in Africa tend to be bigger economically, the researchers suspected that they might also be growing faster. But when they examined the data, they found the opposite. Second, the team wanted to know how quickly big capital and coastal cities, known as primate cities, were growing in comparison to smaller cities. Again, the team’s initial guess was wrong: the economies of big cities were growing more slowly than those of the smaller ones.
Finally, the scientists asked whether malaria, a deadly disease spread by mosquitoes, was stunting economic growth. Weil said, “A lot of economic work has theorized that malaria has an important effect on economic growth.” It seems likely that if malaria were eradicated, economies would grow faster. But without good economic data, nobody could answer this question for sure. The researchers used lights data in regions where malaria had been reduced, and found that in fact, the disease had not seemed to affect aggregate economic growth.
While the researchers’ initial hypotheses were wrong, they noted that before this study, nobody had been able to tackle these questions. “For most countries in Africa, not only are the data very bad, but there are very little of them,” Weil said. “If you want to look at this kind of question, the lights data are the only data that are available.” Storeygard said, “We have this new tool, and we are really just at the start of what we can do with it.”
References
Croft, T. A. 1978. Night-time images of the Earth from space. Scientific American 239: 68–79.
Henderson, J. V., A. Storeygard, and D. N. Weil. 2012. Measuring economic growth from outer space. American Economic Review 102(2): 994–1,028, doi:10.1257/aer.102.2.994.
Doll, C. N. H. 2008. Thematic guide to night-time light remote sensing and its applications.
For more information
NASA Socioeconomic Data and Applications Center (SEDAC)
The DMSP-OLS Sensor and its Data Products
| About the data used | ||
| Data sets | Gridded Population of the World | Global Rural-Urban Mapping Project, version 1 (GRUMPv1) |
| Resolution | 2.5 arc-minute | 30 arc-second |
| Parameter | Population | Population |
| DAAC | NASA Socioeconomic Data and Applications Center (SEDAC) | NASA SEDAC |
The data image in the title graphic shows the Earth’s city lights at night, from data from the Defense Meteorological Satellite Program (DMSP) Operational Linescan System (OLS). Economists are now using satellite lights data as a measure of economic growth, complementing traditional economic data. (Data courtesy M. Imhoff of Goddard and C. Elvidge of NOAA NGDC, image by C. Mayhew and R. Simmon, Goddard)


