Wildfire is an essential process connecting terrestrial systems to the atmosphere and climate. As vegetation burns, it releases smoke, carbon, and other materials into the atmosphere. These fires also release nutrients into the soil and are an integral part of ecological succession, plant germination, and soil enhancement.
NASA's Earth Science Data Systems (ESDS) Program provides unrestricted access to data, services, and tools that enable resource managers, disaster management teams, and scientists to understand and monitor environmental conditions before a fire starts, measure the intensity and development of fires during a burn, and assess the environmental and socioeconomic impacts after a burn. Additional resources are available through NASA's Applied Sciences Wildfires program area and other agency initiatives.
The number, severity, and overall size of wildfires has increased, according to the U.S. Department of Agriculture, through contributing factors including extended drought, the build-up of fuels, past fire management strategies, invasive species targeting specific tree species, and the spread of residential communities into formerly natural areas. In 2022, 68,988 wildfires were reported across the U.S. that consumed 7,577,183 acres, according to the 2022 Annual Report by the National Interagency Coordination Center (NICC). But wildfires also have a human component, and the NICC report notes that "a total of 2,717 structures were reported destroyed by wildfires in 2022, including 1,261 residences, 1,294 minor structures, and 91 commercial/mixed residential structures."

Along with near real-time wildfire data available through NASA's Fire Information for Resource Management System (FIRMS, described below), current U.S. wildfire statistics are available through the National Interagency Fire Center (NIFC).
Fire Information for Resource Management System (FIRMS) and FIRMS US/Canada
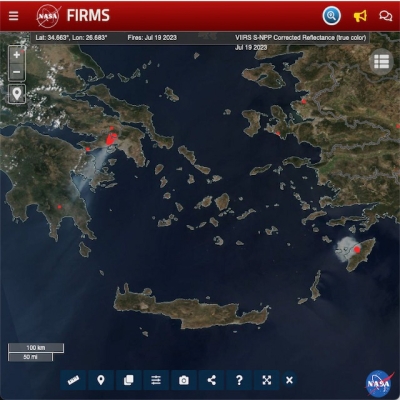
NASA's Fire Information for Resource Management System (FIRMS) distributes global near real-time (NRT) active fire data acquired by the Moderate Resolution Imaging Spectroradiometer (MODIS) and Visible Infrared Imaging Radiometer Suite (VIIRS) instruments aboard Earth orbiting satellites within three hours of an observation. Active fire/hotspot data acquired by instruments aboard geostationary satellites will be added to FIRMS later in 2022. FIRMS is part of NASA's Land, Atmosphere Near real-time Capability for EOS (LANCE).
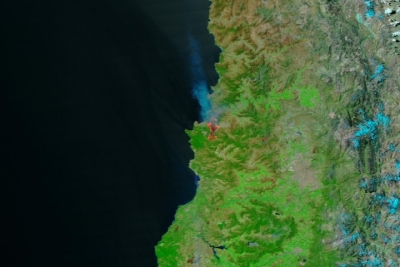
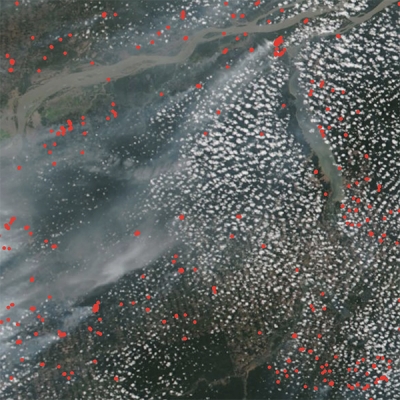
Thermal anomalies detected by MODIS or VIIRS are defined as the center of a 1 km pixel (MODIS) or a 375 m pixel (VIIRS) flagged as containing one or more fires or other thermal anomalies (such as an active volcano). Detected anomalies are updated constantly and plotted as orange (MODIS) or red (VIIRS) dots and indicate the approximate location of a potential wildfire or other thermal anomaly. Users also can sign up to receive alerts for hotspots detected in user-defined areas of interest.
FIRMS provides enhanced interactive tools for visualizing satellite imagery, active fire detections, and other NASA science products relevant to wildfire management. In addition, data (including historical data) can be downloaded in multiple geographic information system (GIS) formats.
LANCE FIRMS developers partnered with the USDA Forest Service to create FIRMS US/Canada. FIRMS US/Canada offers additional contextual layers and enhancements, including integration of U.S. and Canadian fire geospatial data and incident reports, improved classification of fires to show time since detection to better depict active fire fronts, and other information for current large fires in the U.S. and Canada. FIRMS US/Canada also provides U.S. and Canadian administrative ownership boundaries and interagency fire management boundaries, daily fire danger forecasts, and current National Weather Service fire weather watch and red flag warning areas. Near real-time data with real-time availability for selected data sources will be added to FIRMS US/Canada later in 2022.

Learn More About FIRMS and FIRMS US/Canada
- FIRMS Fact Sheet
- FIRMS US/Canada Fact Sheet
- FIRMS Frequently Asked Questions (FAQ)
- Tutorial: How to Use NASA's Fire Information for Resource Management System (FIRMS)
- ArcGIS StoryMap: FIRMS—Managing Wildfires with Satellite Data
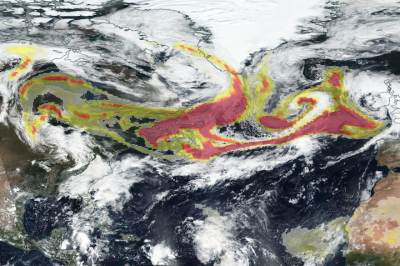
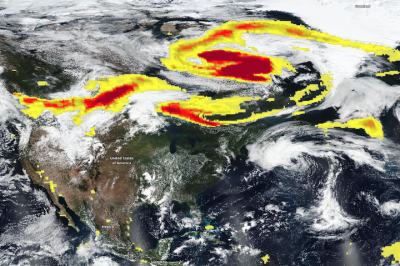
Interactively Explore Wildfire Data in NASA Worldview
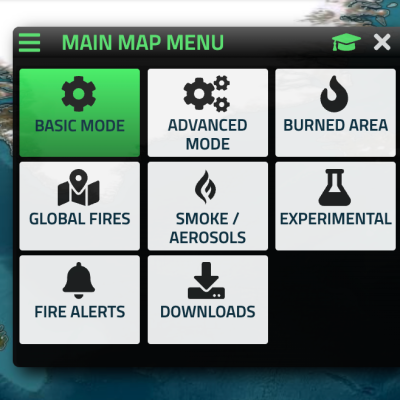
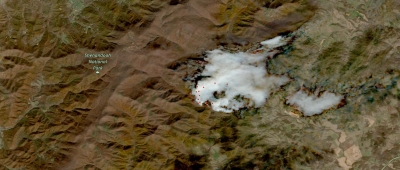
The Worldview map below allows you to interactively explore some of the wildfire resources available through Worldview. The example shows a list of fire events between June 7 and June 17, 2022. Clicking on an event in the Layer List or on the map allows you to see more information and related resources for that event. Clicking on a red or an orange detected thermal anomaly dot brings up vector information about a detected hotspot (you may need to zoom in to activate the vector layer). On the map, you can also change the date in the lower left corner to see how the fires have progressed over time. Click on the map to open the full version of Worldview in a new browser tab to continue the exploration by adding relevant imagery layers, setting up an animation, and much more!

Webinars
NASA Earthdata Webinars span the Earth science disciplines and are designed to help users learn about NASA Earth observing data, services, and tools and show users how to work with these resources.
- NASA Worldview—Explore the Earth from Past to Present with Global Satellite Observations
- Discover NASA’s Near Real-Time Data using LANCE
- Discover NASA’s Fire Information for Resource Management System (FIRMS)
- Discover NASA ISS Lightning and Associated Validation Data from GOES-R
Data Recipes and Tutorials
Data recipes are step-by-step instructions for using and working with Earth science data, information, tools, and services. Tutorials cover many different data products across the Earth science disciplines and different data discovery and data access tools, including programming languages and related software.
- Data Recipes at NASA's Goddard Earth Sciences Data and Information Services Center (GES DISC)
- Data Recipes at NASA's Global Hydrometeorology Resource Center DAAC (GHRC DAAC)
- Tutorials at NASA's Level-1 and Atmosphere Archive and Distribution System DAAC (LAADS DAAC)
- Data Recipes at NASA's Land Processes DAAC (LP DAAC)
- Data Recipes at NASA's Oak Ridge National Laboratory DAAC (ORNL DAAC)
Additional Resources
NASA's Earth Science Applied Sciences Program uses Earth-observing data and applied research to improve the prediction of, preparation for, response to, and recovery from disasters around the world, and the program has a number of resources relevant to wildfire. The Applied Sciences Wildfire program area provides applications and tools based on NASA’s wealth of Earth observations to help communities manage the impacts of fire and is part of a network of collaborators working to reduce wildfire risks before, during, and after events.

One collaborative effort in which the Applied Sciences Wildfire program area is involved is a new NASA initiative called NASA FireSense. NASA FireSense brings together resources from multiple agency components to create the next generation of tools and science-informed capabilities for wildfire adapted communities and to enable society to live sustainably with wildland fires. The initiative includes efforts from NASA’s Science Mission Directorate (which includes NASA's Earth Science Division), NASA’s Aeronautics Research Mission Directorate, and NASA’s Space Technology Mission Directorate.
The Applied Sciences Disasters program area is the home to the NASA Disasters Mapping Portal: Wildfires. The portal provides links to NASA Disasters program resources and features Event Response Story Maps, Event Response galleries, smoke plume height examples, and wildfire damage proxy maps.
Detailed information about NASA resources and missions used for wildfire research, analysis, and tracking is available through the NASA Fire mission page. In addition, NASA's Scientific Visualization Studio has created a wide range of wildfire products, and numerous articles about the uses and applications of wildfire Earth observation data are available through NASA's Earth Observatory. Finally, the YouTube Earthdata GIS Resources playlist has StoryMaps relevant to wildfires and general information about using NASA GIS resources.