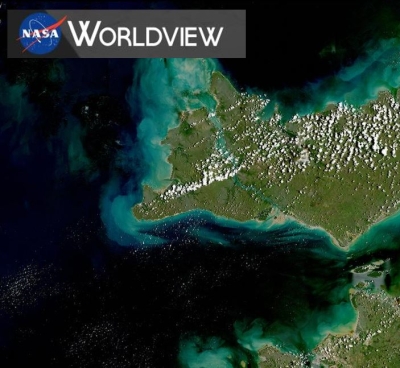
In orbit since December 1999 onboard NASA's Terra satellite, the Moderate-resolution Imaging Spectroradiometer (MODIS), records images of the globe every 24 to 48 hours, providing scientists with information on a wide variety of the Earth's features, including cloud cover and global vegetation. But scientists must be sure MODIS' measurements are accurate. Characterizing the instrument's performance involved an innovative and international collaboration of scientists.
"For each of the MODIS land data products we develop, we want to have some field data, or ground reference, to ensure that what we think we're seeing in the images is truly representative of ground level processes," said Jeff Morisette, MODIS Land Team (MODLAND) Validation Coordinator. "We required detailed information from a global network of research sites to provide us with measurements about aspects of land cover types, vegetation uptake and carbon dioxide release, and atmospheric carbon exchange."

Funding for image validation studies began in 1998 with comparisons between surface and satellite sensor data from, for example, Landsat Thematic Mapper (TM) or Enhanced Thematic Mapper Plus (ETM+), SPOT and Advanced Very High Resolution Radiometer (AVHRR) sensors, and with MODIS imagery when it became available during the 2000 summer growing season.
To ensure accurate comparisons between sensors, field measurements had to be 'scaled-up' so that data collected 100 meters above the ground by aircraft sensors, and data collected by satellite sensors hundreds of kilometers in the air matched the ground-based validation data. In other words, if the field data identified distinct clumps of deciduous trees amongst the surrounding coniferous forest, then the validation team needed to ensure that they could identify the same deciduous vegetation in the remotely sensed imagery.
"Typically, field measurements and/or low altitude aircraft data are collected and used to adjust high-resolution satellite data, such as ETM+ on Landsat 7 or ASTER on Terra, to observed ground parameters. We then take this suite of data to derive high-resolution satellite images that replicate parameters, such as land surface temperature or land cover type, comparable to the MODIS product," Morisette said. "Lastly, we apply an averaging technique to account for scale differences between the high-resolution and MODIS data products."
Using this adjustment process, field data are directly comparable to MODIS data.

International Cooperation
"We needed surface information representative of each different global biome. Financially we don't have the resources to set up all of the required research sites, so we opted to tie into existing international research networks," Morisette said.
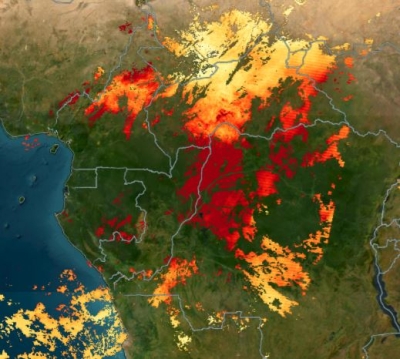
The MODLAND team collected validation information domestically from a variety of sources including the Long Term Ecological Research sites and existing research networks, such as NASA's AERONET (Aerosol Robotic Network) program. Internationally, MODLAND garnered validation data from research projects such as Brazil's Large-scale Biosphere Atmosphere program in Amazonia, the SAFARI 2000 research initiative in Southern Africa, work from Chiba University in Mongolia's grasslands, and data from Canada's boreal forests collected by the Canadian Centre for Remote Sensing (CCRS). Currently, these international land product validation activities are organized through a newly formed subcommittee, the Calibration and Validation Working Group, within NASA's Committee on Earth Observing Satellites.
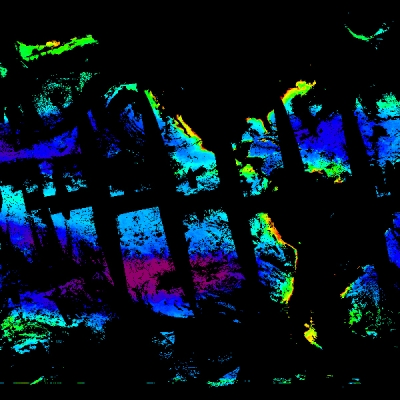
"We've provided the MODIS land validation team with a wide variety of field measurements from nine different ecozones in Canada, and we'll provide information from three additional ecozones by the end of 2001," said Richard Fernandes, research scientist with CCRS' Environmental Monitoring Section. "For each biome, we've picked approximately 20 to 30 plots within 150 square kilometer regions, the area equivalent to a Landsat frame. We use these data to calculate leaf area index (LAI) over Canada for use in models that monitor Canada's carbon and hydrology budget."

Several benefits have resulted from collaborating with international research organizations: CCRS researchers had created algorithms to calculate LAI from satellite imagery, which they shared with members of the MODIS land validation team. CCRS' LAI history spans from 1992 to 2000, and CCRS plans to extend this record back another 10 years.
"We've applied our algorithms to identify LAI in MODIS imagery over Canada, and developed LAI algorithms for use with other sensors for ecozones throughout Canada. After running the data through our algorithms, we can compare MODIS images to imagery from more familiar sensors to get a better idea of what we're seeing in MODIS images," Fernandes said. "So, in addition to providing field data for validation, we plan to make estimates of LAI over Canada using our algorithms and MODIS data available to users via our Web site. We'll also provide our estimated errors using these methods. So other scientists, including MODIS science team members, will have our validation data for input into their algorithms and they can compare their results with ours using MODIS imagery."
Tools Required
"MODIS data will cut anywhere from 50 to 75 percent of the work usually required to obtain nationwide composite images of LAI," Fernandes said. "During this first year, we're taking a lot of time to ensure that we understand everything the MODIS team does to create LAI measurements. Once we have a system for acquiring the information we need we'll directly download the LAI data and project the data into a format compatible with our system software using NASA's Land Processes Distributed Active Archive Center (LP DAAC) reprojection tool, apply our algorithms, and away we'll go," he said.

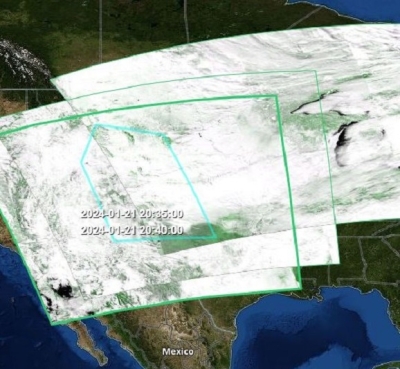
MODIS Land products are generated in the Integerized Sinusoidal (ISIN) grid, a projection that allows for uninterrupted global projection, and therefore, an undistorted global view. MODIS land data users, however, have had difficulty reading the data into the unusual ISIN projection using available software. In answer, LP DAAC created a tool that reprojects MODIS data into a software-compatible format.
"We wanted to provide people with a way to read the data files, extract images from the file, reproject and sample information from a specific study region, and have the final output available in a software-friendly format," said John Dwyer, LP DAAC Project Scientist.
"To create the reprojection tool we used, as a baseline, an ISIN version that integrated computer code from LP DAAC's existing mapping transformation software (the Generalized Cartographic Transformation Package, or GCTP). At the same time we incorporated image resampling software code developed at LP DAAC for use in the Landsat 7 land assessment project," Dwyer said.
Tool users may subset the data by region, which effectively reduces the amount of information downloaded, thereby facilitating data transfer. LP DAAC also hoped to facilitate access to MODIS data for users of all skill levels by creating a graphical user interface that eased data access and navigation.
"NASA's Oak Ridge National Laboratory (ORNL) DAAC uses LP DAAC's Reprojection Tool to provide MODIS products to the community of scientists compiling field measurements and performing product validation. Because of the reprojection tool, ORNL DAAC can provide MODIS products in an immediately useful format for science investigators that don't typically work with remote sensing data," said Dick Olson, staff scientist at ORNL.
"The science community has been a great help in developing the reprojection tool. We've created this tool on a shoestring and had our users provide on-the-fly testing because, outside of some initial tests, we don't have the resources for rigorous, pre-release software testing, said Dwyer. "With each incremental release, people have sent us problem reports so that we could verify and rectify any problems that they've encountered."
"Our group was one of the first to use the MODIS Reprojection Tool," Fernandes said. "We found it invaluable. It works quite well and LP DAAC people are always willing to help us with any problems encountered."

"Subsets of MODIS-derived products, which include surface temperature, vegetation index, LAI, photosynthesis, and surface reflectance, are produced by the MODIS Data Processing System for a select number of validation sites," said Olson. "After reformatting the products using the reprojection tool, ORNL DAAC posts the files online. Eventually, as more products become available, users will be able to quickly evaluate temporal patterns and compare to field measurements."
Active Data Archive
Once the validation process has finished, links to the MODIS land validation data will be provided by ORNL DAAC's Mercury system. Mercury allows researchers to obtain MODIS land data directly from the data provider.
"The provider supplies prospective users with background metadata on his or her data. After specifying the type of data desired, the user goes directly to the data provider's Web site," said Morisette. "Mercury doesn't hold any data, it's a clearinghouse that provides data registration and points to where data reside. We're trying to help ORNL DAAC and the data providers by offering some user service function and data quality assessment so uninitiated users understand what parameters were collected from a particular site and how to use the data."
By creating improved sensors dedicated to environmental and climate research, providing the tools to use and understand the data, and encouraging cooperative research efforts, NASA's Earth Observing System facilitates global research efforts.
For more information
NASA Land Processes Distributed Active Archive Center (LP DAAC)
NASA Oak Ridge National Laboratory DAAC (ORNL DAAC)
South African Regional Science Initiative 2000 (SAFARI 2000) Project
Canadian Centre for Remote Sensing
| About the remote sensing data used | ||
|---|---|---|
| Satellite | Terra | Landsat 7 |
| Sensor | MODIS | TM, ETM+, SPOT, AVHRR |
| Parameter | ISIN | MODIS land validation project |
| DAAC | NASA Land Processes Distributed Active Archive Center (LP DAAC) | NASA LP DAAC |