In Indonesia, it is monsoon season. Water parachutes down from tropical clouds to start its journey toward the sea. Rain pours from the sky in slabs of water that slap the sandy ground of the Indonesian Archipelago. Water rolls off the palm fronds and rocks and saturated soil of the islands of Sumatra, Java, and Borneo, flowing into streams and bays and then out into the Java Sea. The fresh water will ultimately mingle into the crowd of salt water, but during the monsoon, enough of it sweetens a plume that spreads out on the Indian Ocean surface. And in turn, rain-freshened waters flow into the straits in Indonesia from the Pacific Ocean to the Indian Ocean.
Rain and fresh water are ingredients in the ocean’s everyday water cycle, but the oceans are a pot that is never completely stirred. Waters are constantly moving and mixing. Like the patterns of pressure and temperature in the atmosphere that create weather conditions, oceans are busy exchanging heat and fresh water to create a water climate. Fresh water floats near the surface, lighter than the cold, salty water that sinks, especially near the North and South Poles, causing both vertical circulation and a conveyor belt-like circulation of salty and cold water around the globe. The ocean trades its heat with the atmosphere too, helping stabilize the climate patterns that shape our world.
For researchers such as Jim Potemra, who study how oceans circulate and mix near the surface, a new global sea surface salinity-sensing satellite promised a broader, yet closer look at these processes. Still, scientists did not know exactly what the new satellite data might pick up. “When we started gridding the data, we said, let’s have a look at regions where we don’t have a good idea of the surface fluxes. The signal that was coming out of the Indonesian Seas was a little surprising,” Potemra said. It was evidence of a feature that they had mostly imagined.

Fresher water meets saltier water
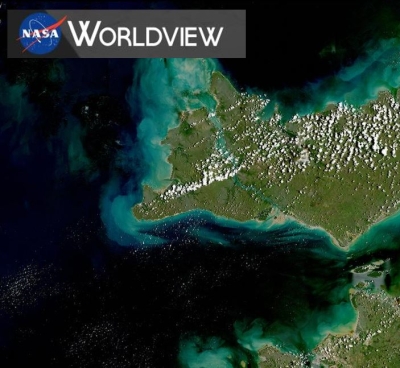
Potemra and his colleagues had some data that told them about a low-salinity plume coming out of Indonesia’s Sunda Strait, which lies between the Indonesian islands of Java and Sumatra and connects the Java Sea to the Indian Ocean. It is as narrow as 15 miles, punctuated at its wider southwest end by a group of small islands, most famously home to Krakatoa Volcano, which exploded in 1883 with the force of 13,000 nuclear bombs.
The researchers had speculated that the fresh water comes not only from the adjoining islands, but also from northern areas. Until now, they had no data to verify its origins. But there in the new data from NASA Aquarius, a space-based instrument to study sea surface salinity, were the northern beginnings of the fresher plume.
Adding rain and runoff is not like turning on a blender. In the tropics, the less dense fresh water may linger on top of the saltier surface a while. Winds and currents transport this fresher layer out to sea, where it eventually disperses and mixes. Before it disappears, this burst of freshness may leave its fingerprints on local conditions. “It could be a part of local exchanges, such as air-sea flux, or controlling local rainfall patterns,” Potemra said. Could it also be part of a larger weather or climate pattern, such as El Niño phases?
In the Java Sea, fresh water from rain runoff slips through several straits, carried along a pathway between the Indian and Pacific Oceans known as the Indonesian Throughflow. It is here in the equatorial Indian and Pacific that the weather pattern called El Niño Southern Oscillation (ENSO) is born, as either the warm phase nicknamed El Niño, characterized by warmer surface waters, or its cooler sister La Niña. These ENSO phases bring wetter or drier years to Indonesia and Australia, and more or fewer cyclones and rain to the tropical Pacific, and extend wet or dry conditions across North and South America and beyond.
But what kicks off an ENSO phase? Models have some skill in forecasting ENSO based on surface temperatures and other variables, but sometimes a phase can fizzle instead of forming. Recently, researchers have noted salinity changes accompanying El Niño and La Niña, leading them to dig further into the relationship between sea surface salinity and ENSO. Could salinity help trigger these changes by influencing vertical exchange of cold and warm waters, or could changes in salinity mark the turn? What they saw suggested that it could be either or both. This was one of several compelling questions that prompted NASA to launch Aquarius.
Before satellite data became available, researchers had to build computer models to simulate and study these forces on a global scale, and buoys scattered about key locations as well as autonomous floats broadly distributed over the open ocean provided local measurements to feed the models. Potemra’s colleague at the University of Hawaii, Peter Hacker said, “Jim had been doing numerical modeling on the South China Sea and Indonesia. That’s how our study got started.” But the buoys and floats are sparse and nearsighted, while the models are farsighted and cannot see many details.

A global look at the ocean surface
Aquarius promised to help them see in between. “Aquarius was going to provide salinity coverage on a scale we’ve never had, every 10 kilometers [6 miles], with 100 kilometers [62 miles] of spatial averaging for each measurement. It is a bit like having three very fast ships driving parallel to each other across the whole globe, day after day after day,” Hacker said. Aquarius carried three radiometers that measured the subtle differences in levels of microwave emissions due to the salts in the waters. Aquarius team members Oleg Melnichenko and Nikolai Maximenko, together with Hacker and Potemra’s colleagues at the University of Hawaii, turned these emission readings into high-resolution sea surface salinity maps.
Digging through imagery, their eyes were drawn to bursts of fresh water passing through the Sunda Strait, between the islands of Sumatra and Java, and into the Indian Ocean. “It’s the only low latitude connection between ocean basins. It’s a way that the Pacific Ocean can communicate with the Indian Ocean, and it’s important because the dynamics of salinity are different at the equator than at the poles,” Potemra said. Rather than causing deep vertical ocean circulation, as in polar oceans, contrasts in salinity in the tropics may have quicker and more local effects, helping identify highly productive fishing spots, for example.
Patches of fresh water had been identified in that area of the Indian Ocean, but many researchers thought heavy rains caused them. With the Aquarius data, the freshwater injections through the strait began to emerge in detail. Once out to sea, the bursts of fresh water could be seen to travel west, or south, or stay close to the strait, depending on the season and currents. Wind patterns around the islands create changes in sea level that help force the fresh waters through the strait, particularly during the Southeast Monsoon.
The data showed that the Sunda Strait was fresher during the 2011 El Niño, adding evidence of a link between ENSO and salinity. While this plume of fresh water would not have been the main trigger for the 2011 El Niño, it highlights the need to understand smaller scale processes better. Adding this knowledge to the complex models that help forecast ENSO patterns could increase forecast reliability. Better models could eventually trickle down to help people facing wet and dry years due to ENSO around the world make better preparations.

Near the shore
The Aquarius mission collected data from 2011 to 2015, when its satellite platform stopped operating. A European satellite, the Soil Moisture and Ocean Salinity (SMOS) mission, continues the job of sensing salinity, while other Earth observing satellites have joined the effort. NASA's Soil Moisture Active Passive (SMAP) mission, though designed to measure soil moisture, carries an instrument that also may be used to measure sea surface salinity.
While the new abundance of salinity data is promising, this study revealed the utility of remotely sensing salinity in small features like the Sunda Strait that are typically under-sampled by traditional methods. “It’s an important issue in studying the Indonesian Throughflow, where there are a lot of islands causing a problem for the satellite,” Hacker said. “Often these freshwater plumes are close to shore.” The satellite data are masked out near the shore to ensure that the land does not contaminate the signal. “How do we get to the area that’s masked out?” Potemra said. “Looking at the raw data, we could see there were some issues.” The SMAP satellite is providing an advantage over Aquarius by enabling satellite salinity measurements closer to the coast.
For Hacker, Potemra, and others, finding their way in a new data set is a fun problem to have. “Doing any kind of science that has new observations is really exciting,” Hacker said. “It’s like walking through a forest you’ve never been through before. That’s what’s so interesting about Aquarius.”
References
NASA Aquarius project. 2015. Aquarius Official Release Level 2 Sea Surface Salinity. Ver. 4.0. PO.DAAC, CA, USA. doi:10.5067/AQR40-2SOCS.
Potemra, J. T., P. W. Hacker, O. Melnichenko, and N. Maximenko. 2016. Satellite estimate of freshwater exchange between the Indonesian Seas and the Indian Ocean via the Sunda Strait. Journal of Geophysical Research: Oceans. doi:10.1002/2015JC011618.
For more information
NASA Physical Oceanography Distributed Active Archive Center (PO.DAAC)
NASA Soil Moisture Active Passive (SMAP)
| About the remote sensing data | |
|---|---|
| Satellite | Satélite de Aplicaciones Científicas (SAC-D) |
| Sensor | Aquarius |
| Data set | Aquarius Official Release Level 2 Sea Surface Salinity Version 4 |
| Resolution | 96 kilometer (Along) x 390 kilometer (Across) |
| Parameter | Salinity |
| DAAC | NASA Physical Oceanography Distributed Active Archive Center (PO.DAAC) |