Dr. Anne Nolin, Professor; College of Earth, Ocean, and Atmospheric Sciences; Oregon State University
Research interests: Mountain hydroclimatology, remote sensing of snow, and mountain social-ecological systems.
Research highlights: It is impossible to overestimate the importance of mountain snowpacks and associated glaciers to water resources. As Dr. Anne Nolin notes, snowpacks and glaciers are the lifeblood of the western U.S. and similar regions around the world, storing water in winter and gradually releasing this water during spring (from snow) and summer (from glaciers) as the snow and ice melt. Nolin’s work on snowpack and mountain environments attempts to map, monitor, and characterize these vital ecosystems.
Satellite remote sensing data are a critical component of Nolin’s research. Not only do these satellite data provide imagery of remote, often inaccessible mountainous areas, they also provide data for computer models designed to mathematically represent environmental conditions and are used to update these models as they run. In addition, Nolin and her colleagues use remotely-sensed data to validate model output and augment snow information from ground-based mountain monitoring stations, which may be few in number, spread out over large distances, or difficult to reach.
Research by Nolin shows that global warming is leading to changes in these ecologically sensitive regions. These changes affect not only mountain ecosystems, but also the resources that flow from mountain regions. As Nolin and her colleagues observe, “Mountain snowpack is a key common-pool resource, providing a natural reservoir that supplies water for drinking, worship, hydropower, agriculture, ecosystems, industry, and recreation for over 1 billion people globally.” Changes in these snowpack resources also affect the human mountain communities depending on these resources. Nolin’s work seeks to understand mountain regions as a system that couples human dimensions with these biophysical areas.
In a recent study, Nolin and her colleagues looked at the impacts of climate and precipitation changes on maritime mountain snowpack in the McKenzie River Basin (MRB) in Oregon’s Cascade Mountains. While about one-third of the annual mountain precipitation in this region falls as snow, much of this snowfall occurs at temperatures close to 0˚C (32˚F). This means that only a small increase in temperature is needed to change the precipitation from snow to liquid. Since the snowpack stores water in the winter and gradually releases this stored water during the melt season, an increase in temperature can significantly impact water for forests, fish, energy, production, and agriculture in this region. Through the use of model simulations and remotely-sensed data (including data from the Landsat Thematic Mapper) coupled with ground-based observations of precipitation, temperature, and the amount of water contained in the snowpack (called “snow water equivalent,” or SWE), Nolin and her colleagues evaluated the sensitivity of this snowpack to projected temperature increases of 2˚C and variabilities in precipitation of ±10%.
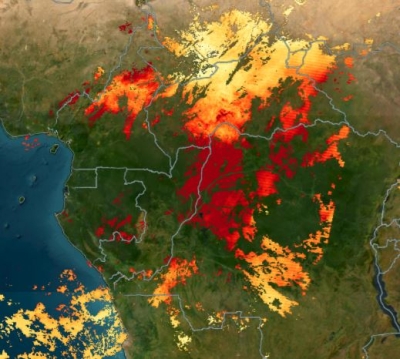
As rising temperatures reduce snowpacks, research in the Western U.S. shows that one consequence is an increase in wildfire frequency, size, intensity, and duration. When a forest burns, charred debris (such as burned trees) falls onto the forest floor. Nolin and her colleagues investigated how this charred debris changes the amount of light and radiation that is absorbed or reflected from the forest floor and the impact of these changes in reflectance on snowmelt rates and intensity.
The amount of light and radiation reflected by a surface is called albedo. Fresh snow reflects a high percentage of light and radiation that strikes it and has a high albedo. Charred debris, on the other hand, reflects much less light and radiation, and has a much lower albedo. Solar radiation that is not reflected by a surface (such as sunlight striking dirty snow) is absorbed, causing the upper layers of the surface to increase in temperature. Remotely sensed data, specifically a spatial analysis combining snow cover, fire, and forest cover data from the Moderate Resolution Imaging Spectroradiometer (MODIS) instrument, allowed the research team to calculate the amount of burned area in their study sites and monitor the changes in albedo in these areas as they recovered.
Nolin and her colleagues also are using MODIS snow cover data to develop new snow metrics as geospatial products to support the National Climate Assessment. These snow data products will soon be available through Google Earth Engine, which will allow users to tailor the web-based maps and data output to individual needs. In addition, Nolin and her colleagues developed a remote sensing glacier-mapping pilot project called IceTrendr. IceTrendr uses Landsat time-series data to capture, label, and map glacier change for use in climate science, hydrology, and Earth science education. The interactive web interface the team developed allows them to map glacier change and label the change processes.
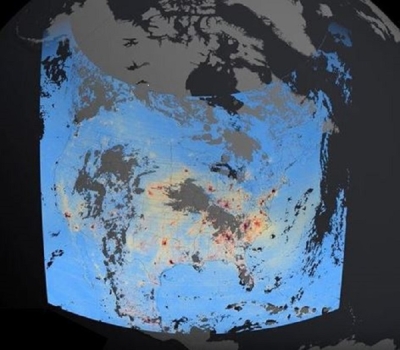
Finally, Nolin and her colleagues used data from the Multi-angle Imaging SpectroRadiometer (MISR) instrument aboard the Terra Earth observing satellite to map and analyze Greenland ice sheet roughness. Since the surface of the Greenland ice sheet is shaped by wind, melting processes, and glacier dynamics, the roughness of this ice sheet causes changes in the amount of heat reflected or absorbed by the ice sheet surface and can impact ice sheet development.
Data products used:
- MODIS/Terra snow cover, Daily, 500-m grid (MOD10A1, doi:10.5067/MODIS/MOD10A1.006), available through the National Snow and Ice Data Center Distributed Active Archive Center (NSIDC DAAC)
- MODIS snow-covered area and grain size (MODSCAG) 500-m grid, available through the Snow Data System portal at NASA’s Jet Propulsion Laboratory
- MISR Level 1B2 Terrain Data: terrain projected top of atmosphere radiance, resampled at the surface and topographically corrected (MI1B2T, doi:10.5067/Terra/MISR/MI1B2T_L1.003), available through the Atmospheric Science Data Center (ASDC).
- Landsat Thematic Mapper (TM) and Operational Land Imager (OLI) data, available through the U.S. Geological Survey’s EarthExplorer and Global Visualization Viewer (GloVis)
Research findings: Results from Nolin’s exploration into the effects of projected climate changes on maritime mountain snowpack in the Oregon Cascades found that this snowpack is highly sensitive to increasing temperatures, with snowpack between elevations of 1,000 and 2,000 meters (about 3,280 to 6,560 feet) being particularly sensitive. Specifically, she and her colleagues found that peak SWE decreases 56% when temperature increases by 2˚C. Also, projected warmer temperatures hasten the snowpack melt cycle, with peak SWE occurring 12 days sooner. The research team found that while temperature increases are the primary driver of diminished snowpack accumulation, variabilities in precipitation produce noticeable changes in the timing and storage of water in the snowpack. The combination of diminished snowpack resulting from projected temperature increases along with expected increases in the population that will depend on water from this snowpack could lead to water management concerns. Since maritime snow comprises about 10% of Earth’s seasonal snow cover, Nolin and her colleagues observe that the results from this case study can be applied to areas of maritime snowpack around the world.
In her study of the effects of burned debris on snowmelt, Nolin found that snow accumulation was greater in a burned forest study area when compared with an unburned study area. However, the snowpack in the burned study area disappeared 23 days earlier and had twice the melting or evaporation rates than in the unburned forest. Snow albedo was 50% lower in the burned forest, leading to a substantial increase in heat absorbed by the upper layers of soil in the burned area.
Looking at the surface roughness of the Greenland ice sheet, Nolin and her colleagues found that the ice sheet’s surface roughness changes significantly over the course of the melt season, primarily from April to July, and varies from year to year depending on the amount of melt and the dynamics of the outlet glaciers along the ice sheet margin. Nolin also found that roughness values are lower in the dry, snow-covered interior of the ice sheet and much higher along the crevassed margins of the ice sheet.
Read about the research:
Gleason, K.E. & Nolin, A.W. (2016). Charred forests accelerate snow albedo decay: parameterizing the post-fire radiative forcing on snow for three years following fire. Hydrological Processes, 30(21). doi:10.1002/hyp.10897
Gleason, K.E., Nolin, A.W. & Roth, T.R. (2013). Charred forests increase snowmelt: Effects of burned woody debris and incoming solar radiation on snow ablation. Geophysical Research Letters, 40(17). doi:10.1002/grl.50896
Nolin, A.W. & Mar, E. (2013). Greenland Ice Sheet Surface Roughness and Glacier Zones from MISR, 2000-2013. American Geophysical Union, Fall Meeting 2014, abstract #GC51E-0468 [Bibliographic Code: 2014AGUFMGC51E0468N].
Sproles, E., Nolin, A.W., Rittger, K. & Painter, T. (2013). Climate change impacts on maritime mountain snowpack in the Oregon Cascades. Hydrology and Earth System Science, 17(7). doi:10.5194/hess-17-2581-2013
Nolin, A.W. (2012). Perspectives on climate change, mountain hydrology, and water resources in the Oregon Cascades, USA. Mountain Research and Development, 32(S1). doi:10.1659/mrd-journal-d-11-00038.s1
Nolin, A.W. & Payne, M.C. (2006). Classification of glacier zones in western Greenland using albedo and surface roughness from the Multi-angle Imaging SpectroRadiometer (MISR). Remote Sensing of Environment, 107(1-2). doi:10.1016/j.rse.2006.11.004
For more information
- Landsat Thematic Mapper (TM)
- Moderate Resolution Imaging Spectroradiometer (MODIS)
- Multi-angle Imaging SpectroRadiometer (MISR)
- EarthExplorer
- Global Visualization Viewer (GloVis)