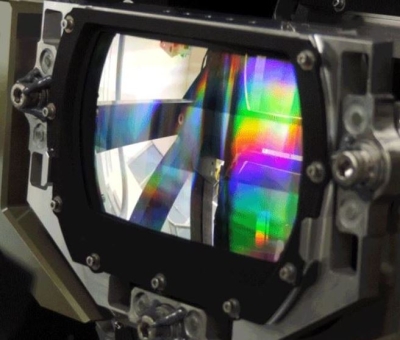
Satellite data may hold the key to answering global change questions in remote areas where many geophysical secrets would otherwise remain hidden. Satellites offer scientists daily, low-resolution data. However, these data frequently require refinement to enhance image clarity.
A research group at San Diego State University interested in the seasonal dynamics of plant growth in the Arctic has both taken advantage of and improved available satellite data from NASA's Land Processes Distributed Active Archive Center (LP DAAC) in Sioux Falls, South Dakota. Using Landsat and Advanced Very High Resolution Radiometer (AVHRR) data, the Team produced false color maps showing a variety measurements of interest to environmental scientists. For example, the Team can show how much green vegetation grew in a given area; and soon it may be able to tell how much standing water in lakes came from melted snow.

"We wanted to characterize the seasonal dynamics of vegetation over large areas of the Arctic during the short growing season of arctic tundra vegetation on Alaska's North Slope," said Douglas Stow, professor at San Diego State University.
Working with the U.S. Geological Survey (USGS) Biological Research Division in Anchorage, Stow and his colleagues, Professor Allen Hope and graduate students, William Boynton and Lloyd Coulter, started with EROS data composed of the clearest images in daily data from 15-day periods each summer month from 1990 through 1994. Taking the EROS compositing process a step further, Stow and the researchers used a technique that employed high-resolution neighboring views to infer details. They created pictures from the satellite data that could be compared with those collected from airplanes.
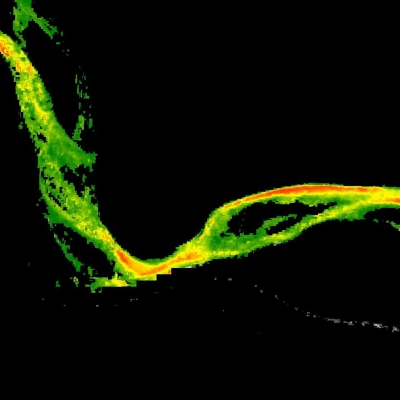
The result was a map of the Kuparuk River Basin surface vegetation so detailed that it allowed the researchers to predict the area's gross primary productivity. Gross primary productivity provides information about how much energy and carbon are being exchanged between the land and atmosphere. Measurements of these "fluxes" are needed as input for climate models.

"By determining the amount of green vegetation in a 3-square-kilometer area we created values comparable to other energy and carbon dioxide flux studies," said Stow. Secondly, these satellite observations help Stow's team select specific sampling sites for making in situ measurements from towers and aircraft.
According to Stow, the presence of water strongly influences how readily vegetation can be identified in the images—even after the rigorous process of data screening. To fully understand the relationship between water vapor, vegetation, and carbon dioxide uptake, the researchers had to account for water's effect in each satellite image.
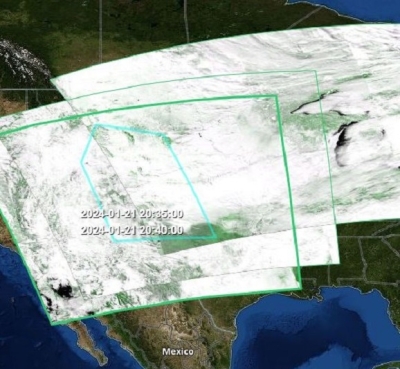
Few good data existed for 1995 due to excessive cloud cover. For 1996, Stow and colleagues created their own composites, again using LP DAAC's satellite data. This process resulted in some serendipitous research benefits.
"Ultimately, we may be able to estimate how much standing water results from snow melt by comparing the amount of water in the early versus the late season," Stow said.
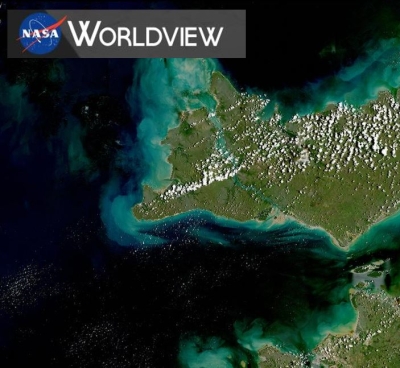
"In eliminating the water effects from these composites, we identified regions of surface water cover, and essentially produced a map describing the proportion of water in the region. Such information is not readily available even in high-resolution images," Stow said. Of course, melting snow contributed to the size and depth of the lakes. But Stow's team identified persistent water bodies in the images, such as the larger lakes on the north slope, late in the summer season when there was no snow cover.
"Ultimately, we may be able to estimate how much standing water results from snow melt by comparing the amount of water in the early versus the late season," Stow said.
"Our research strategy has been to add value to existing satellite data archives while ensuring data fidelity, to make it easier to identify vegetation, and to study the climate. The challenge is, how far can you go in using remotely-sensed data to extend or extrapolate from precise, detailed measurements that are spatially limited?" said Stow.
For more information
NASA Land Processes Distributed Active Archive Center (LP DAAC)
| About the remote sensing data used | ||
|---|---|---|
| Sensor | AVHRR | |
| Parameter | arctic vegetation | |
| DAAC | NASA Land Processes Distributed Active Archive Center (LP DAAC) | |