In 1869, John Wesley Powell led a team down the Colorado River to explore the last empty spot on the U.S. map. For ninety-eight days, they toiled in wooden rowboats, finally passing through the treacherous rapids of the Grand Canyon. After the trip, Powell predicted western states would be embroiled in water wars and widespread drought. In fact, the mighty river is now so overdrawn that it has reached its final outlet to the Pacific Ocean only a few times since 1960. The rich ecosystem the river once fed and the people who flourished from the delta are long gone.
Yet the Colorado River is just one of many beleaguered rivers in the United States, raising a question: Do we have enough water to meet our needs, now and in the future? Or is the dry Colorado River Delta a scene that will be played out again and again across the country as we continue to overuse our most precious resource? To help find the answers, 145 years after Powell’s expedition, the United States Geological Survey (USGS) is embarking upon the first National Water Census, a massive project that aims to take stock of our nation’s water supply.

Balancing the water budget
Figuring out how much water is available across the U.S. is not simple. David Blodgett, a USGS civil engineer said, “When we say availability, it has to take into account ecological integrity and human needs along with climate change going into the future.” That means estimating how much water will be available over the next fifty years.

To get that estimate, Blodgett said, they need to understand the ever-changing equation of water in versus water out. Like any household budget, a water budget is developed by balancing how much comes in, rain and snowfall in this case, with how much goes out, through runoff, evaporation, and evapotranspiration by trees and plants.
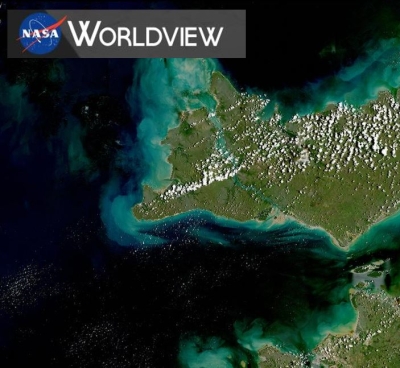
One of their first areas of focus is the Colorado River basin. The river and its tributaries have flowed for millions of years, carving out the Grand Canyon as it winds through a sprawling basin that spans seven states, from western Wyoming to California and into northern Mexico. Dozens of watersheds cross over state and county lines. Hundreds of thousands of pipelines siphon off water for various uses.
In spite of this demand, the Colorado River sustains ecosystems and agriculture in an arid part of the nation. It has made hot, high desert cities like Palisade, Colorado renowned for its plump peaches and thriving vineyards. But at the end of the river, the once-abundant delta is now two million acres of brackish mudflats and shrunken wetlands.
If such decline is preventable, or even reversible, ecologists need to know how much water it takes to sustain an ecosystem. “We need to understand what streams are suitable for what critters—fish, invertebrates, animals, plants—essentially, what the ecosystem type is,” Blodgett said. If streams in a given region of the country typically flood each spring, then dry up by mid-summer, for example, that has implications for the types of plants and animals that can live there. “If we can get a national picture of stream flow character,” he said, “then we can start to more intelligently say this is how much water we really need for this or that ecosystem to thrive.” Likewise, water managers need stream flow data to estimate how much water will be available for their municipalities. The well-established USGS National Water Information System (NWIS) with its more than seven thousand stream gauges is already providing that piece of the water cycle equation.

Realizing rainfall
But there is more to the water budget than runoff. Rainfall, evaporation, and transpiration by plants need to be considered as well. Eventually groundwater will also be factored in, but for now it poses too many challenges, such as understanding the myriad rock properties surrounding groundwater wells. “Getting a spatial distribution of precipitation is hard, but getting a spatial distribution of ground water is even harder,” Blodgett said. “So you begin with rainfall. If you don’t have that right, you can’t get the rest right.”

One researcher who knows rainfall is Peter Thornton at the Oak Ridge National Laboratory (ORNL), who developed a data set called Daymet. While working in Montana forests, he and his colleagues were struck by a lack of precipitation and temperature measurements, critical for understanding forest hydrology and productivity. Temperature data are especially helpful for estimating evaporation and transpiration rates. “We needed a way to connect the dots in between measurement stations,” Thornton said.
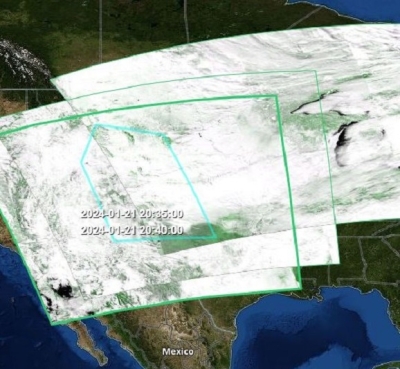
Thornton realized he could garner observations of temperature and precipitation that were already being made in backyards and back lots across the country, and even in Mexico and Southern Canada. Many of these stations are part of a network of citizen scientists and farmers who monitor conditions on their property using instruments certified by the National Weather Service (NWS). By pulling these together with other national networks, Thornton and his team built an extensive map of ground stations across most of North America.
As a result, Daymet, which is available from NASA's Oak Ridge National Laboratory Distributed Active Archive Center (ORNL DAAC), provides daily readings of rain and snowfall, as well as local temperatures and other meteorological data, such as how wet the soil is, daily humidity, and how much moisture is in the snowpack. “Daymet is the rainfall truth,” Blodgett said. Thornton added, “Anyone can pull these data for their neighborhood to find out what the long-term temperature is like, or the extreme cold temperature in the last thirty years.”
Accounting for ET
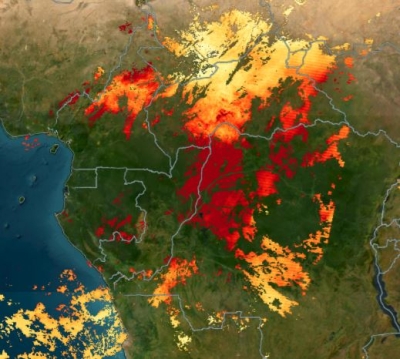
Next, Blodgett and his team focused on another major player, evapotranspiration (ET). This is the water lost either through evaporation to the atmosphere, such as through the many tens of thousands of irrigation ditches that cross the country, or through transpiration of plants and trees. For this piece of the hydrologic cycle, they are drawing on both USGS and NASA data.
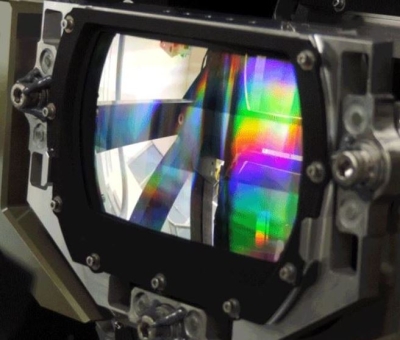
“We’re using remote sensing to get the big picture and then calibrating the remote sensing with these networks of very high accuracy and very high time resolution,” he said. The ET database was built using Moderate Resolution Imaging Spectroradiometer (MODIS) satellite imagery that is cross-referenced with eddy flux tower data, measurements that tell them how much water moves through the atmosphere versus down through the ground. Combined, these elements—from stream flow to satellite imagery—are providing the most comprehensive picture of water availability to date.

Restoring water
In 2014 the USGS released a data portal that offers all National Water Census data in one place, including stream flow statistics, Daymet data, ET estimates, and reports on aquatic biology. This will allow anyone, from state water managers to local farmers, to build a budget for their watersheds to monitor changes between supply and demand and ultimately determine how much water is available. “What we’re doing right now is providing the best information we can to help people answer that question,” Blodgett said.
The team thinks that this surge of scientific measurements will lead to promising applications. “I’m amazed at the number of ways people have applied these data,” Thornton said, regarding the Daymet data. “It has taken on a life of its own,” he said. Studies using Daymet have ranged from the biodiversity of fireflies to the spread of insect and disease pathogens. “We’ve even generated this information for vintners so they can customize where they plant particular varietals on which slopes and which elevation and so on,” Thornton said.
The data may even prove helpful for scientists working to restore impoverished ecosystems like the Colorado Delta. In spring 2014, scientists conducted an historic experiment by opening the gates of Morelos Dam between Arizona and Mexico long enough to allow a surge of water through. Their goal was to mimic the spring runoff that once refreshed the basin each year. Onlookers danced and played tubas as the first lip of the stream lined the dry river bed on its way through San Luis Río Colorado, Mexico. Two months later, the Colorado River reached the Sea of Cortez, its final outlet to the Pacific Ocean.
References
United States Geological Survey (USGS). National Water Census Web site. Available online from USGS, Reston, Virginia USA.
Thornton, P. E., M. M. Thornton, B. W. Mayer, N. Wilhelmi, Y. Wei, R. Devarakonda, and R. B. Cook. 2014. Daymet: daily surface weather data on a 1-km grid for North America, version 2. Oak Ridge, Tennessee, USA: NASA Oak Ridge National Laboratory (ORNL) Distributed Active Archive Center (DAAC), doi:10.3334/ORNLDAAC/1219.
Thornton, P. E., S. W. Running, and M. A. White. 1997. Generating surfaces of daily meteorological variables over large regions of complex terrain. Journal of Hydrology 190: 214-251, doi:10.1016/S0022-1694(96)03128-9.
For more information
NASA Oak Ridge National Laboratory Distributed Active Archive Center (ORNL DAAC)
DAYMET: Daily Surface Weather and Climatological Summaries
United States Geological Survey (USGS) National Water Census
NASA Land Processes DAAC (LP DAAC)
| About the data | ||
| Satellite | Terra | |
| Sensors | Various meteorological sensors | Moderate Resolution Imaging Spectroradiometer (MODIS) |
| Data sets | Daymet daily surface weather data | Daily land surface temperature and emissivity |
| Resolution | 1 kilometer | 1 kilometer |
| Parameters | Temperature, precipitation, surface radiation, snow water equivalent, vapor pressure | Land surface temperature, emissivity |
| DAACs | NASA Oak Ridge National Laboratory Distributed Active Archive Center (ORNL DAAC) | Land Processes DAAC (LP DAAC) |
The photograph in the title graphic shows the Rio Grande as it flows through New Mexico. (Courtesy A. Gross/Wikimedia)